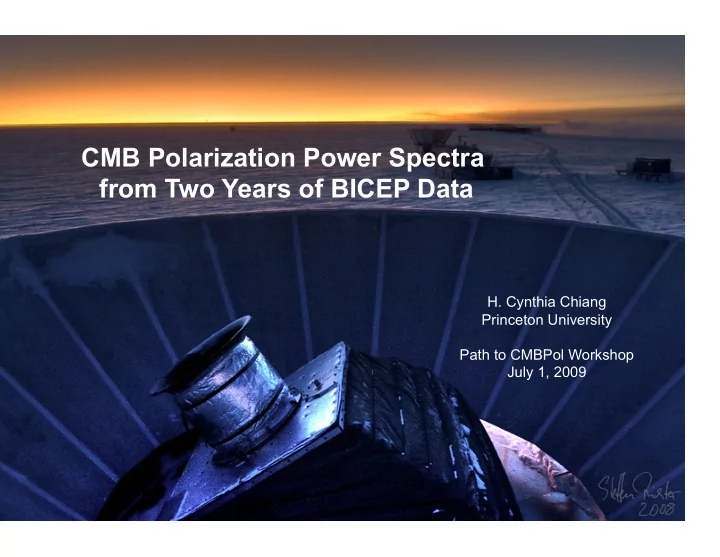

CMB Polarization Power Spectra from Two Years of BICEP Data H. Cynthia Chiang Princeton University Path to CMBPol Workshop July 1, 2009 H. C. Chiang
Searching for B-mode polarization in the CMB TT E-mode polarization: mainly sourced by density fluctuations B-mode polarization: generated by inflationary gravitational waves EE and lensing Inflationary B-mode amplitude is BB parameterized by tensor-to-scalar ratio, current upper limit is r < 0.22 (WMAP TT + BAO + SN) Target inflationary B-mode at angular scales of ~ 30 < ell < 300 H. C. Chiang
Background Imaging of Cosmic Extragalactic Polarization Caltech / JPL Andrew Lange Viktor Hristov Tomo Matsumura John Battle John Kovac Hien Nguyen James Bock Erik Leitch Steffen Richter Darren Dowell Pete Mason Graca Rocha UC Berkeley UC San Diego U Chicago Bill Holzapfel Brian Keating Clem Pryke Yuki Takahashi Evan Bierman Chris Sheehy Princeton Stanford NIST Ki Won Yoon Bill Jones Chao-Lin Kuo Cynthia Chiang Jamie Tolan IAP, Paris IAS, Orsay CEA Grenoble Eric Hivon Nicolas Ponthieu Lionel Duband Cardiff NRAO Peter Ade Denis Barkats H. C. Chiang
Overview of the BICEP telescope Minimize polarization systematics Azimuthal symmetry Simple refractor, no mirrors Optimize to 30 < < 300 Beam sizes ~ 0.9 deg, 0.6 deg Field of view ~ 18 deg Observed sky fraction ~ 2% Frequency coverage 100 GHz: 25 pixels 150 GHz: 22 pixels 220 GHz: 2 pixels Signal-to-noise considerations PSB differencing South Pole: long integration over contiguous patch of sky, reduced atmospheric loading (Yoon et al., astro-ph/0606278) H. C. Chiang
Target field and scan strategy Primary CMB field: “Southern Hole” Dust emission 100x lower than median Total emission minimized at 150 GHz 48-hour observing cycles 4 x 9-hour CMB observations Az / el raster scans Fixed boresight angle {-45°, 0°, 135°, 180°} Three years of data: 2006 to 2008 Initial analysis: first two years Conservative data cuts 150 GHz FDS dust model H. C. Chiang
Instrument characterization Bolometer transfer functions Method: Gunn or noise diode source, analyze response to transitions Result: relative gain uncertainty < 0.3% over 0.1 – 1 Hz after deconvolution Relative gains Method: atmospheric signal from “elevation nods” Result: common mode rejection > 98.9% Absolute gains and detector pointing Method: cross-correlate BICEP and WMAP temperature maps Result: gain uncertainty ~2%, centroid uncertainty 0.03° rms H. C. Chiang
Instrument characterization Cross-polar leakage and polarization orientation angle Method: rotating polarized sources (dielectric sheet, wire grid, etc.) Result: cross-polar leakage uncertainty ±0.01, orientation angle uncertainty ±0.7° Main beam shapes Method: map far-field sources (thermal source and noise diode) Result: average FWHM 0.93°, 0.60° at 100, 150 GHz; differential pointing 1.3 ± 0.4% More details: Takahashi et al., arXiv:0906:4069 H. C. Chiang
Timestreams to maps Form gain-adjusted sum/diff PSB timestreams, polynomial filter + azimuth template subtraction Noise in two-year polarization maps: 0.81 µ K and 0.64 µ K per sq. deg. at 100 and 150 GHz H. C. Chiang
From maps to power spectra Output of Spice kernel Ell space filter function Spice estimator Noise power spectrum Beam / pixel factor The answer: underlying C l H. C. Chiang
EE and BB from BICEP BICEP detects EE peak at ell ~ 140 with high S/N BB spectrum is consistent with zero, other spectra consistent with LCDM Polarization data pass jackknife consistency tests H. C. Chiang
Potential systematics Uncertainties in calibration quantities can leak T, E into B Define r = 0.1 benchmark for systematics: false BB < 0.007 µ K 2 at ell ~ 100 Use signal simulations to calculate false BB from systematic errors Instrument property Benchmark ( r = 0.1) Measured 0.9% Relative gain uncertainty <1.1% 3.6% Differential beam size < 0.3% 1.9% Differential pointing 1.3 ± 0.4% 1.5% Differential ellipticity < 0.2% 2.3° Polarization orientation uncertainty < 0.7° 5 arcmin Telescope pointing uncertainty 0.2 arcmin -9, -4 dBi Polarized sidelobes (100, 150 GHz) -26, -17 dBi 3 nK Focal plane temperature stabiility 1 nK 4 µ K Optics temperature stability 0.7 µ K More details: Takahashi et al., arXiv:0906:4069 H. C. Chiang
Constraint on r from BICEP BB Assume fixed LCDM parameters, calculate template BB, vary r Calculate chi-squared and likelihood as function of r BICEP BB: r = 0.03, +0.31, -0.27, upper limit is r < 0.73 at 95% confidence H. C. Chiang
The state of the field BICEP contributes highest S/N polarization measurements at ell ~ 100 BB upper limits are the most powerful to date Upcoming analysis will use full data set, relaxed data cuts... plenty of room for improvement! BICEP two-year results: arXiv:0906.1181 BICEP data: http://bicep.caltech.edu H. C. Chiang
Recommend
More recommend