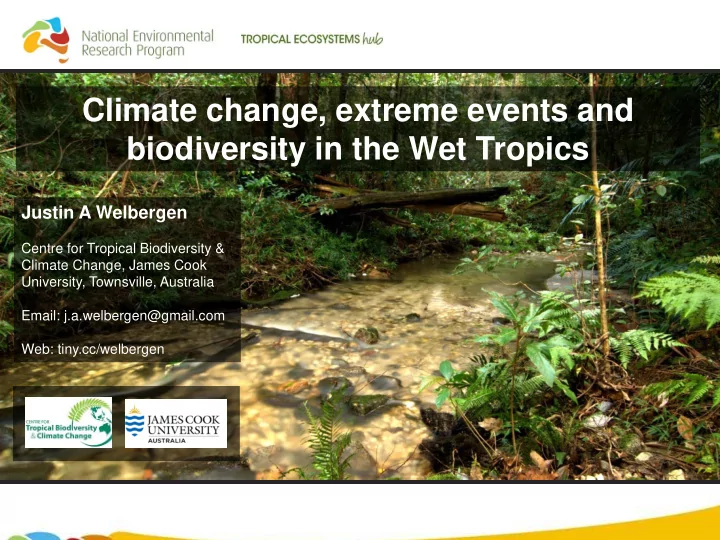

Climate change, extreme events and biodiversity in the Wet Tropics Justin A Welbergen Centre for Tropical Biodiversity & Climate Change, James Cook University, Townsville, Australia Email: j.a.welbergen@gmail.com Web: tiny.cc/welbergen
The global average temperature is currently higher than at any time during the last 1,200 years (IPCC Fourth Assessment Report)
If you are 27 years or younger, you’ve never experienced a month where the global average temperature was colder than the 20 th century average for that month
The Arctic sea ice on September 21, 1979
The Arctic sea ice on September 13, 2012
What are ‘extreme events’? 800 700 600 500 Frequency 400 300 200 100 0 10 15 20 25 30 35 40 45 Some athmospheric weather or climate variable (e.g. temperature in degrees C) They are values of atmospheric weather and climate variables that are found towards the ends of the normal range
Temperature extremes
Precipitation extremes
Cyclones
There are other events that are sometimes considered ‘extreme events’, including: • droughts • fires • dust storms • floods • landslides • etc. ..but these are all in some way or another derived from the atmospheric extremes.
temperature extremes • Among the principal ways in which humans and other organisms strongly experience climate change • Fundamental expressions of climate change due to their direct link with increased heat content of the atmosphere • Most data-rich relative to other kinds of extreme events
… through shifts in the mean and the shape of temperature distribution
(Animation) Northern Hemisphere temperature anomalies 1950-2011 NASA/Goddard Space Flight Center GISS and Scientific Visualization Studio
Extreme summer temperatures can cause significant mortality amongst humans 2003 heat wave Number of deaths per month (from Beaumel et al 2005)
Extreme summer temperatures can cause mass die-offs in biodiversity
The impacts of extreme events on tropical biodiversity • Tropical rainforests are the hotbed of the world’s biodiversity • The vulnerability of tropical rainforest biota to extreme events is largely unknown • Tropical species may already be living close to their maximum thermal tolerances
Assessing vulnerability of biodiversity to extreme events Microhabitat-scale Resilience ‘Adaptive capacity’ Landscape-scale exposure exposure • Behavioural plasticity • Thermal tolerance • Outputs year 1: Accurate high-resolution maps of the exposure to temperature extremes as experienced by organisms in-situ Based on Williams, S.E., Shoo, L.P., Isaac, J.L., Hoffmann, A.A.& Langham, G. (2008). PLoS Biol , 6, 2621-6.
Estimates of exposure Downscaled estimates of historical enabling hourly estimates closely predict hourly daily maximum and minimum of historical temperature in temperatures in key key microhabitats. temperature... microhabitats... 11:00 am Empirical Tmax (canopy) Maximum temperature (ground) on August 17 th Temperature in the 1953 canopy at 12:00 pm on August 17 th 1953 Downscaled Tmax (ground) + Empirical Tmax (canopy) 13:00 14:00 etc. Time Welbergen et al unpublished
Estimates of exposure We can estimate the exposure of any species with a know distribution and microhabitat use Welbergen et al unpublished
Assessing vulnerability of biodiversity to extreme events Microhabitat-scale Resilience ‘Adaptive capacity’ Landscape-scale exposure exposure • Behavioural plasticity • Thermal tolerance • Outputs year 2: Accurate estimates of the sensitivity of organisms to temperature extremes
Estimates of “ Resilience” = The ability of species to recover from environmental disturbances Rank Resilience index Binomial species’ name Common name IUCN Status 1 0.000 Techmarscincus jigurru Bartle Frere cool-skink NL 2 0.001 Eulamprus frerei Bartle Frere barsided skink NL 3 0.009 Cophixalus neglectus Tangerine nursery-frog EN B1ab(v)+2ab(v) 4 0.087 Hemibelideus lemuroides Lemuroid ringtail possum LR NT 5 0.091 Cophixalus monticola Mountain top nursery-frog EN B1ab(v)+2ab(v) 6 0.100 Cophixalus hosmeri Pipping nursery-frog VU D2 7 0.103 Lampropholis robertsi Grey-bellied sunskink NL 8 0.104 Trichosurus vulpecula johnstonii Coppery brushtail possum LR LC 9 0.105 Taudactylus rheophilus Northern tinkerfrog CR A2ac; B2ab(v) 10 0.109 Antechinus godmani Atherton antechinus LR NT 11 0.111 Saproscincus czechurai Saproscincus czechurai NL 12 0.112 Sminthopsis leucopus White-footed dunnart DD 13 0.116 Glaphyromorphus mjobergi Atherton Tableland mulch-skink NL 14 0.120 Pseudochirulus herbertensis Herbert river ringtail possum LR NT 15 0.123 Acanthiza katherina Mountain thornbill LC 16 0.123 Uromys hadrourus Masked white-tailed rat LR NT 17 0.125 Prionodura newtoniana Golden bowerbird LC 18 0.128 Ptilonorhynchus violaceus Satin bowerbird LC 19 0.128 Dasyurus maculatus Spotted-tailed quoll VU C1+2a 20 0.130 Sericornis keri Atherton scrubwren LC Welbergen et al, unpublished
Estimates of “Behavioural plasticity” = The ability of species to seek out cooler microhabitats Welbergen et al, unpublished
Estimates of “ Thermal tolerance” = The ability of species to withstand certain temperatures Example : Green ringtail possums will not survive when the ambient temperature exceeds > 30 o C for more than 5 h per day for more than 4 consecutive days (Krockenberger et al 2012). The species is only present where this temperature regime does not occur. Welbergen et al, unpublished
Vulnerability Microhabitat-scale Resilience ‘Adaptive capacity’ Landscape-scale exposure exposure • Behavioural plasticity • Thermal tolerance Our final aim is to conduct vulnerability assessments and produce:
Vulnerability: expected outputs • Maps of the areas where biodiversity is currently most vulnerable to temperature extremes (‘thermal hotspots’) • Maps of the areas where biodiversity is least vulnerable to temperature extremes in the future (‘thermal refugia’) • List of species particularly at risk from extreme events
THANK YOU CONTACT Name: Justin Welbergen Organisation: James Cook University, Townsville Phone: (07) 4781 4479 Email: Justin.Welbergen@jcu.edu.au
Recommend
More recommend