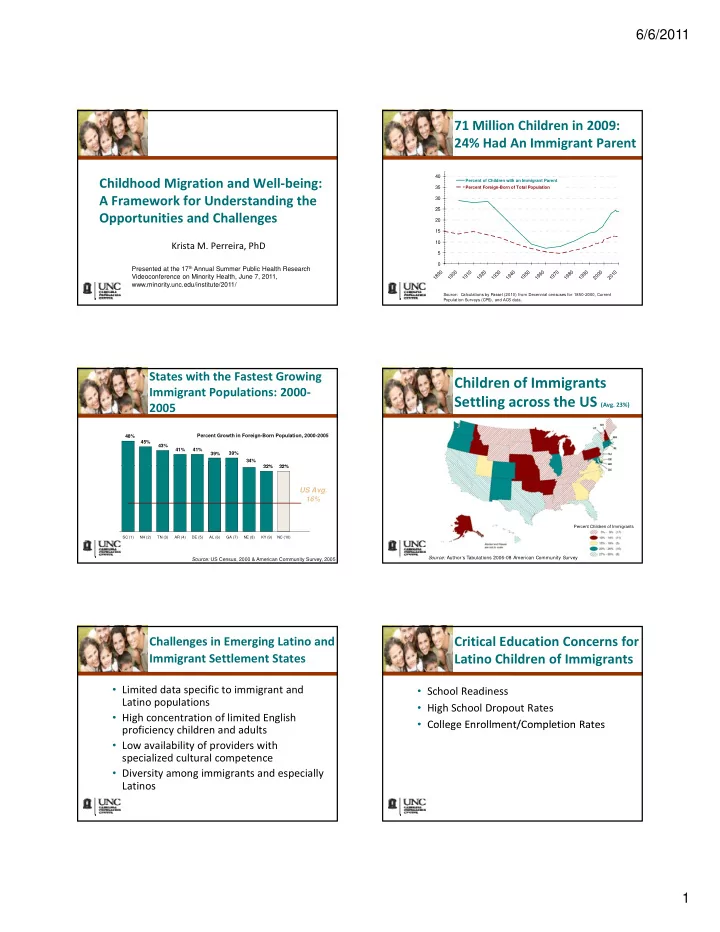

6/6/2011 71 Million Children in 2009: 24% Had An Immigrant Parent 40 Childhood Migration and Well ‐ being: Percent of Children with an Immigrant Parent 35 Percent Foreign-Born of Total Population A Framework for Understanding the 30 25 25 Opportunities and Challenges 20 15 10 Krista M. Perreira, PhD 5 0 Presented at the 17 th Annual Summer Public Health Research 0 0 0 0 0 0 0 0 0 0 0 0 0 9 0 1 2 3 4 5 6 7 8 9 0 1 Videoconference on Minority Health, June 7, 2011, 8 9 9 9 9 9 9 9 9 9 9 0 0 1 1 1 1 1 1 1 1 1 1 1 2 2 www.minority.unc.edu/institute/2011/ Source: Calculations by Passel (2010) from Decennial censuses for 1850-2000, Current Population Surveys (CPS), and ACS data. States with the Fastest Growing Children of Immigrants Immigrant Populations: 2000 ‐ Settling across the US (Avg. 23%) 2005 Percent Growth in Foreign-Born Population, 2000-2005 48% 45% 43% 41% 41% 39% 39% 34% 32% 32% 32% 32% US Avg. 16% Percent Children of Immigrants SC (1) NH (2) TN (3) AR (4) DE (5) AL (6) GA (7) NE (8) KY (9) NC (10) Source: Author’s Tabulations 2006-08 American Community Survey Source: US Census, 2000 & American Community Survey, 2005 Critical Education Concerns for Challenges in Emerging Latino and Immigrant Settlement States Latino Children of Immigrants • Limited data specific to immigrant and • School Readiness Latino populations • High School Dropout Rates • High concentration of limited English • College Enrollment/Completion Rates • College Enrollment/Completion Rates proficiency children and adults • Low availability of providers with specialized cultural competence • Diversity among immigrants and especially Latinos 1
6/6/2011 Kindergarten School Kindergarten School Readiness, Reading Readiness, Math 3rd+ Generation White 3rd+ Generation Mexican American 3rd+ Generation White 3rd+ Generation Mexican American 2nd Generation Mexican American 1st Generation Mexican American 2nd Generation Mexican American 1st Generation Mexican American 100% 80% 80% 60% 60% 40% 40% 20% 20% 0% 0% Identifying Numbers Understanding Solving Addition and Letter Recognition Sound Recognition Word Recognition and Shapes Ordinality Subtraction Source: Reardon, SF & Galindo, C. (2006), Patterns of Hispanic Students’ Source: Reardon, SF & Galindo, C. (2006), Patterns of Hispanic Students’ Mathematics and English Literacy Test Scores. Report to the National Task Force Mathematics and English Literacy Test Scores. Report to the National Task Force on Early Childhood Education for Hispanics . Tempe, AZ: Arizona State University. on Early Childhood Education for Hispanics . Tempe, AZ: Arizona State University. % of Population with a High School Drop Out Rates Bachelors Degree 1st generation* 2nd generation 3rd+ generation 1st generation 2nd generation 3rd+ generation * Includes adults who never attend school in US 70% 25% r olds 60% olds 20% d) d) 50% 50% % 25-34 year % 18-26 year (weighted (weighte 15% 40% 30% 10% 20% 5% 10% 0% 0% Hispanic Asian Black White Hispanic Asian Black White Source: Perreira, Mullan-Harris, & Lee (2006), Making It in America: High School Source: Baum, S. & Flores, S. (2011), Higher Education and Children in Immigrant Completion among Immigrant Youth. Demography 43(3): 511-536. Families, Future of Children 21(1): 171-193. Based on CPS, March Supplement, 2009 Critical Health Concerns for The Latino Experience : Latino Children of Immigrants Parent/Caregiver Mental Health 50% • Declining Health of Immigrants with Time 45% in the US 40% 35% • Mental Health and Substance Use Mental Health and Substance Use 30% 30% 27% 27% 22% 25% • Overweight/Obesity and related conditions 20% 14% (e.g., Diabetes) 15% 10% • Asthma 5% 0% • Access to Health Care At Risk for Depression Experienced Trauma Serious Symptoms of (PHQ-9) Depression Foreign-Born Latina Mothers (NC LAMHA Study 2004-05, N=275) 2
6/6/2011 The Latino Experience: The Latino Experience : Substance Use Adolescent Mental Health (ages 12 ‐ 18) 25% 35% 30% 20% 25% 15% 20% 1st generation 15% 2nd generation 10% 10% 3rd+ generation 5% 5% 0% Problematic Repeated 0% 1st 2nd 3rd+ 1st 2nd 3rd+ Alcohol Use Marijuana Use generation generation generation generation generation generation Depressive Symptoms Suicidal Ideation Source: Hispanic Add Health Sample, 1993-94 (ages 12-18) Source: Add Health Sample, 1993-94 The Immigrant Experience: The Latino Experience: Obesity Childhood Asthma Non ‐ Hispanic White Hispanic 1st Generation 19.2 20 30% Non ‐ Hispanic Black Hispanic 2nd Generation 27% Hispanic ‐ All Hispanic 3rd Generation 15.7 24% 22% 25% 10 ‐ 17 s 3 ‐ 17 Hispanic ‐ Puerto Rican Black 1st Generation 15 19% Asian 20% 20% Black 2nd Generation 18% 18% % Children ages 17% Prevalence Age Black 3rd Generation 15% 8.8 10 15% 12% White 1st generation 6.8 11% 15% White 2nd Generation 9% 10% White 3rd Generation 3.6 5 Asian 1st Generation 5% Asian 2nd Generation 0% Asian 3rd Generation 0 Obesity Currently Has Asthma Source: NHIS 2008 Source: NSCH 2003, Singh (2009) The Latino Experience: The Immigrant Experience: Access to Health Care Access to Health Care Non ‐ Hispanic White 80% 20 17.2 18.2 Non ‐ Hispanic Black 70% Hispanic der 18 15 Mexican Background 60% Asian (data imprecise) 50% 50% % Children un 10 6.77.5 40% 6.3 4.5 4.8 6.2 6 30% 5 20% 1.4 0 10% Uninsured for Delayed Care 0% Health Care Due to Cost Private Insurance Medicaid/ Public Uninsured Coverage Insurance Adult US Citizen NonCitizen (> 5 yrs) NonCitizen (<= 5 yrs) Source: NHIS 2008 Child US Citizen NonCitizen (>= 5 yrs) NonCitizen (< 5 yrs) Source: KFF 2009 3
Recommend
More recommend