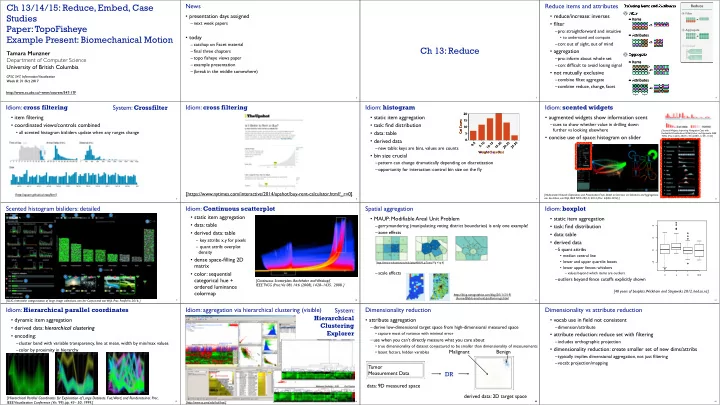

Ch 13/14/15: Reduce, Embed, Case News Reduce items and attributes Reducing Items and Attributes Reduce Filter Filter Studies • presentation days assigned • reduce/increase: inverses Items –next week papers • filter Paper: TopoFisheye –pro: straightforward and intuitive Aggregate Attributes Example Present: Biomechanical Motion • today • to understand and compute –con: out of sight, out of mind –catchup on Facet material Embed Ch 13: Reduce • aggregation –final three chapters Tamara Munzner Aggregate –topo fisheye views paper –pro: inform about whole set Department of Computer Science Items –example presentation –con: difficult to avoid losing signal University of British Columbia –(break in the middle somewhere) • not mutually exclusive CPSC 547, Information Visualization –combine filter, aggregate Week 8: 31 Oct 2017 Attributes –combine reduce, change, facet http://www.cs.ubc.ca/~tmm/courses/547-17F 2 3 4 Idiom: cross filtering Idiom: cross filtering Idiom: histogram Idiom: scented widgets System: Crossfilter 20 • item filtering • static item aggregation • augmented widgets show information scent 15 • coordinated views/controls combined • task: find distribution –cues to show whether value in drilling down 10 further vs looking elsewhere [Scented Widgets: Improving Navigation Cues with • all scented histogram bisliders update when any ranges change • data: table 5 Embedded Visualizations. Willett, Heer, and Agrawala. IEEE • concise use of space: histogram on slider TVCG (Proc. InfoVis 2007) 13:6 (2007), 1129–1136.] • derived data 0 –new table: keys are bins, values are counts Weight Class (lbs) • bin size crucial –pattern can change dramatically depending on discretization –opportunity for interaction: control bin size on the fly [https://www.nytimes.com/interactive/2014/upshot/buy-rent-calculator.html?_r=0] [http://square.github.io/crossfilter/] [Multivariate Network Exploration and Presentation: From Detail to Overview via Selections and Aggregations. van den Elzen, van Wijk, IEEE TVCG 20(12): 2014 (Proc. InfoVis 2014).] 5 6 7 8 Scented histogram bisliders: detailed Idiom: Continuous scatterplot Spatial aggregation Idiom: boxplot • static item aggregation • MAUP: Modifiable Areal Unit Problem • static item aggregation • data: table ! –gerrymandering (manipulating voting district boundaries) is only one example! • task: find distribution ! 4 ! ! • derived data: table –zone effects • data: table ! ! – key attribs x,y for pixels 2 ! • derived data – quant attrib: overplot –5 quant attribs density 0 • median: central line • dense space-filling 2D • lower and upper quartile: boxes [http://www.e-education.psu/edu/geog486/l4_p7.html, Fig 4.cg.6] ! 2 matrix ! • lower upper fences: whiskers ! –scale effects • color: sequential – values beyond which items are outliers n s k mm –outliers beyond fence cutoffs explicitly shown categorical hue + [Continuous Scatterplots. Bachthaler and Weiskopf. IEEE TVCG (Proc. Vis 08) 14:6 (2008), 1428–1435. 2008. ] ordered luminance [40 years of boxplots. Wickham and Stryjewski. 2012. had.co.nz] colormap https://blog.cartographica.com/blog/2011/5/19/ the-modifiable-areal-unit-problem-in-gis.html [ICLIC: Interactive categorization of large image collections. van der Corput and van Wijk. Proc. PacificVis 2016. ] 9 10 11 12 Idiom: Hierarchical parallel coordinates Idiom: aggregation via hierarchical clustering (visible) System: Dimensionality reduction Dimensionality vs attribute reduction Hierarchical • dynamic item aggregation • attribute aggregation • vocab use in field not consistent Clustering • derived data: hierarchical clustering –derive low-dimensional target space from high-dimensional measured space –dimension/attribute Explorer • capture most of variance with minimal error • attribute reduction: reduce set with filtering • encoding: –use when you can’t directly measure what you care about –includes orthographic projection –cluster band with variable transparency, line at mean, width by min/max values • true dimensionality of dataset conjectured to be smaller than dimensionality of measurements • dimensionality reduction: create smaller set of new dims/attribs –color by proximity in hierarchy Malignant Benign • latent factors, hidden variables –typically implies dimensional aggregation, not just filtering –vocab: projection/mapping Tumor Measurement Data DR data: 9D measured space derived data: 2D target space [Hierarchical Parallel Coordinates for Exploration of Large Datasets. Fua, Ward, and Rundensteiner. Proc. IEEE Visualization Conference (Vis ’99), pp. 43– 50, 1999.] 13 14 46 15 16 [http://www.cs.umd.edu/hcil/hce/]
Recommend
More recommend