
SLIDE 1
1
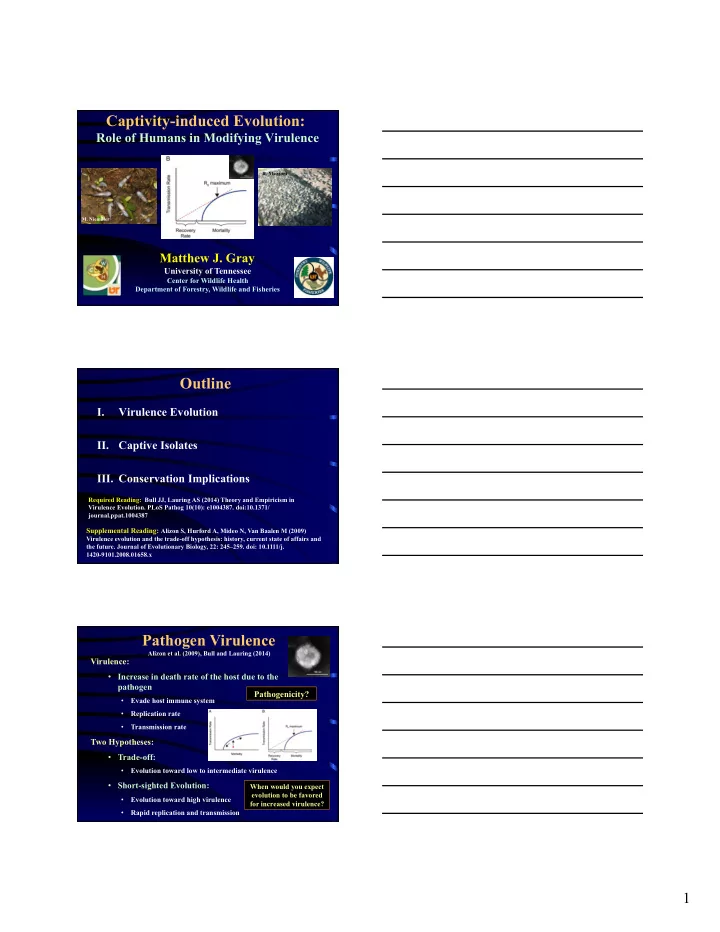
Captivity-induced Evolution:
Role of Humans in Modifying Virulence
University of Tennessee
Center for Wildlife Health Department of Forestry, Wildlife and Fisheries
Matthew J. Gray
- M. Niemiller
- R. Mazzoni
Outline
I. Virulence Evolution II. Captive Isolates
- III. Conservation Implications
Required Reading: Bull JJ, Lauring AS (2014) Theory and Empiricism in Virulence Evolution. PLoS Pathog 10(10): e1004387. doi:10.1371/ journal.ppat.1004387
Supplemental Reading: Alizon S, Hurford A, Mideo N, Van Baalen M (2009)
Virulence evolution and the trade-off hypothesis: history, current state of affairs and the future. Journal of Evolutionary Biology, 22: 245–259. doi: 10.1111/j. 1420-9101.2008.01658.x
Pathogen Virulence
Virulence:
- Increase in death rate of the host due to the
pathogen
- Evade host immune system
- Replication rate
- Transmission rate
Two Hypotheses:
- Trade-off:
- Evolution toward low to intermediate virulence
- Short-sighted Evolution:
- Evolution toward high virulence
- Rapid replication and transmission
Pathogenicity?
Alizon et al. (2009), Bull and Lauring (2014)
When would you expect evolution to be favored for increased virulence?