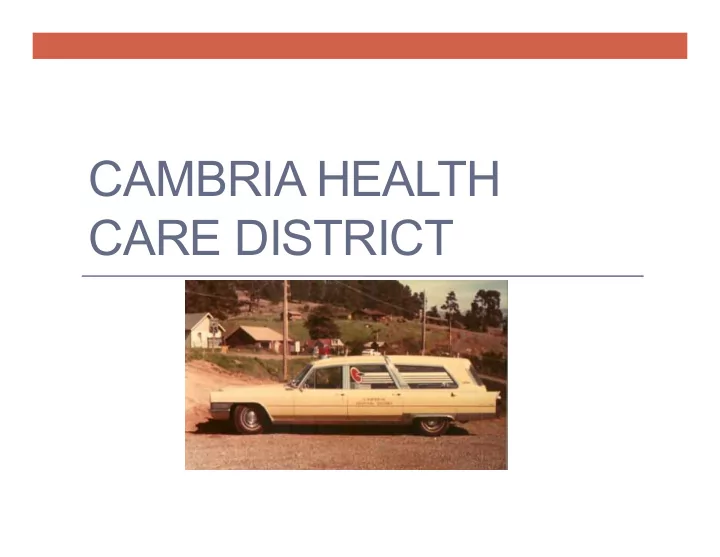

CAMBRIA HEALTH CARE DISTRICT
Quality Improvement Process
QI Program Indicators • Personnel (current certification) • Equipment and Supplies (maintain inventory checks) • Documentation ( ePCR) • Clinical Care and Patient Outcomes (STEMI, CPR and Trauma) • Skills Maintenance/ Competency (HPCPR, airway) • Transportation/ Receiving Facilities(appropriate destinations) • Public Education (hands-only CPR programs) • Prevention (participation in bike safety programs)
CHCD Requests & Responses January - June 2015/2016 (6 mo. Comparison) 478 454 2016 2015 289 277 41 28 # Requests Transports Code 3
Historical EMS Transport Volume by Hospital 2010 2015 21% 19% 33% 30% 19% TCCH 20% FHMC 26% MMC 25% 2% SVRMC 5% TCCH 2010 - 13,355 2015 - 15,273 14.36% increase
Responses by Location
Cambria Destination Destination 2015 2016 Hospital TCCH 40 38 SVRMC 178 157 FHMC 54 84 Other 10 5
Cambria Call Types Medical 8487 7819 CHCD = 3.5% 280 270
Medical by Chief Complaint 6 Cardiac Arrest 7 2016 2015 1 Stroke 1 14 RES Distress 16 2 7 STEMI
Trauma Volume 1779 1635 Trauma Trauma triage 265 268 77 59 11 6
Origin of Trauma Alerts - Q1 & Q2 Nipomo/ So Co Five Cities/Pismo/Oceano San Luis Obispo Morro Bay/ Los Osos/Cayucous Cambria/San Simeon Atascadero/S. Margarita No County Paso/Templeton 0% 5% 10% 15% 20% 25% 30%
Origin of Consults - Q1 & Q2 19% Nipomo/ So Co 12% 24% Five Cities/Pismo/Oceano 22% 11% San Luis Obispo 18% 4% Morro Bay/ Los Osos/Cayucous 7% 5% Cambria/San Simeon 0% 13% Atascadero/S. Margarita 16% 17% No County 13% 6% Paso/Templeton 12% Quarter 2 Quarter 1
Trauma by Mechanism of Injury 7 Other 5 2015 2016 4 Bike 3 28 Falls 48 20 MVA/MCA 21
HPCPR Results Arrests and Outcomes Q1 Q2 2015 • A) Total number of EMS responses to cardiac 36 44 216 arrests • B) Total number of cardiac arrest of cardiac origin 25 29 n/a meeting study criteria • C) Total number of cardiac arrest transported to a 10 15 110 hospital included in study • D) Total of # treated and transported that 9 11 35 survived to ED admission • E) Total of # treated and transported that 7 8 21 survived to HOSPITAL admission • F) Number survived to discharge 5 6 16 • G) % of total # treated/transported that survived 50% 40 % 15% to discharge (F/C) • H) Number in study group that survived to 5 5 17 discharge with normal function • I) Number in study group survived to admission 2 2 n/a and place on DNR/Comfort care • J) % of treat/transported/survived to ED admission 55% 55% 48% and discharged with normal/functional neurologic status( H/D)
Procedures Procedure Cambria % success SLO Co % Success CPAP 39 660 IV 65 97% 1149 86% ET 2 100% 36 80% ETCO2 1/1 (*) 50% 85% ASA 17/20 85% 92% Administration EMS State Core Measures Median Measures for 2015: ET - 73.3% ETCO2 – 88% ASA administration - 66%
SLO Co. Response and On Scene Times For Trauma Onscene Time Response Time 17.37 16 31 8.33 17.67 8.47 14 Step 1-2 13.53 Step 3-4 Median 90th % Median 90th %
Response, Scene and Transport Times - Cambria 41.34 31.17 33 Trauma 20.58 STEMI 17 13.6 Cardiac Arrest 12.16 7.79 6 Response On-Scene Transport
Questions?
Recommend
More recommend