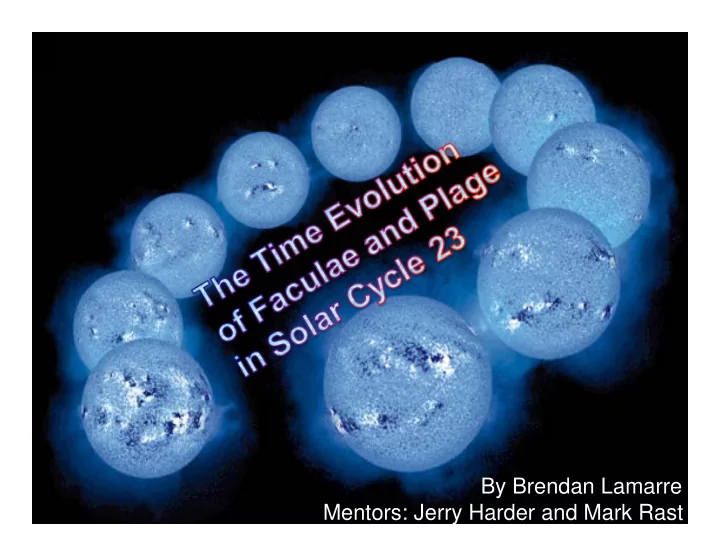

By Brendan Lamarre Mentors: Jerry Harder and Mark Rast
Irradiance Trends (Harder et al., 2010)
Jan 15 th , 2005 Ca II K (393.45nm) Jan 15 th , 2005 Red (607.095nm) Jan 25 th , 2009 Ca II K (393.45nm) Jan 25 th , 2009 Red (607.095nm)
Jan 15th, 2005 Ca II K (393.45nm) Jan 15th, 2005 Red (607.095nm) Jan 25 th , 2009 Ca II K (393.45nm) Jan 25 th , 2009 Red (607.095nm)
What are Faculae and Plage? • Faculae, plural of facula, means “small torch” in Latin • Created by intense, vertical clusters of magnetic field lines in photosphere • On average 1-2kG • Brightness (Darkness) is very dependent on disk position and wavelength • Bright in Ca II (Harder et al., 2010) • Plage is just faculae viewed in the chromosphere
Facula Hot Wall Model (Topka et al., 1997)
Mask Creating a Mask Image A Mask image is the combination of the dark pixels of sunspots in the red wavelength and the Red bright pixels of active Ca II K regions in Ca II K 7 models are used to place the pixels in bins corresponding to active features 1 3 6 7 2 4 5 Internetwork Active Sun Spot Sun Spot Network Plage Facula Network Penumbra Umbra
Find all Ca, Red, Blue, and Mask images For all images Read in fits file, throw out edge of solar disk, and remove clv and Integrate from � =.2 -> align images 1 in steps of .1 Where the Where the mask image = 6 mask image = 5 (Faculae) (Plage) Determine Determine which pixels which pixels are dark and are dark and bright bright Plot % of dark Plot % of dark Plot % of dark facula and plage facula to total plage to total to total facular facular area plage area and plage area
Bright Dark • Faculae and plage pixels are determined from Ca II histogram (blue curve) •Once identification is made, where do this pixels lay on the Red Image histogram (red curve)?
Dark Faculae Bright Faculae All Faculae and Plage Dark Plage Bright Plage
Averages of the percentage of area for 81 day bins at different disk locations
Irradiance Changes Compared with Solar Features’ Areas When progressing to solar minimum: -Decrease in dark faculae and facular area causes increase in irradiance -Increase in bright faculae and decrease in facular area means little irradiance change due to bright faculae -Overall, increase in irradiance with (Harder et al., 2010) decreasing solar activity
Faculae and plage cannot completely account for the magnitude of the change in the increasing irradiances. This suggests that the internetwork and network may similarly influence the irradiance change. However, unlike changes in faculae and plage, the network is too big and diffuse to contribute observable changes.
Conclusion � With High Solar Activity � Larger areas of faculae and plage � Larger fraction of dark faculae � Suppression of irradiance � With Low Solar Activity � Smaller areas of faculae and plage � Larger fraction of bright faculae � Irradiance from bright faculae is about constant due to smaller facular area conflicting with larger fractional area of bright faculae In conclusion, the evolution of faculae and plage in the descending phase of Solar Cycle 23 is consistent with the observation that there are offsetting trends in the spectral irradiance.
References Harder, J., Fontenla, J., Rast, M., Merkel, A., Pilewskie, P., and Richard, E. “What the SORCE SIM observations tell about solar spectral irradiance”, Aspen Global Change Institute, 2010. In Text Citation: (Harder et al., 2010) Topka, K. P., Tarbell, T. D., & Title, A. M. 1997, The Astrophysical Journal, 484, 481 In Text Citation: (Topka et al., 1997)
Recommend
More recommend