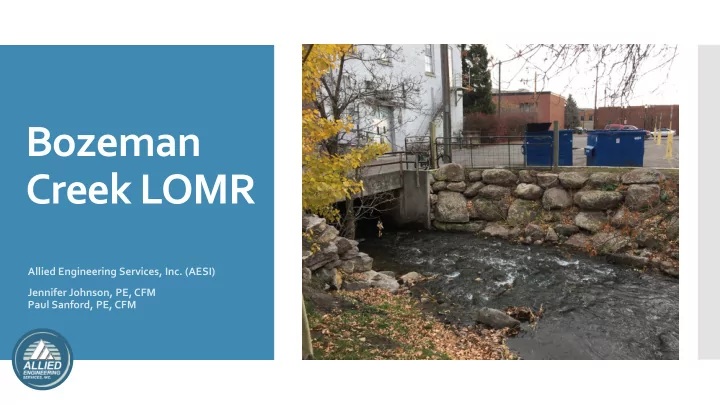

Bozeman Creek LOMR Allied Engineering Services, Inc. (AESI) Jennifer Johnson, PE, CFM Paul Sanford, PE, CFM
Project Background & Objectives Modeling Approach 2D Modeling Presentation Outline 1D Modeling Results Questions and Answers
Project Large-scale floodplain mapping was last completed for Background the Bozeman area in 1988 with a digital conversion of the data occurring in 2011. Bozeman Creek & Tributaries Floodplain Study, Phase 2 Completed by FEMA, DNRC, Contractors Draft hydraulic model and floodplain mapping – 2015 Completed for Incorporation into the Gallatin County and Incorporated Areas DFIRM and FIS Supersedes 2011 FIS
Project Background Image Credit: DNRC
Project Background • Draft floodplain mapping for Bozeman Creek was completed around the time HEC-RAS 2D was emerging as a modeling tool • The City of Bozeman was interested in exploring 2D modeling in the downtown area Image Credit: Google Earth
1D Modeling Challenges Urban environment with complex flow splits Pervasive shallow flooding Long hydraulic structures with limited conveyance capacity Olive-Rouse: ~230 feet; 12 ft x 5 ft opening Babcock Street: ~185 feet; 16 ft x 5.3 ft opening Main Street: ~320 feet; 12.6 ft x 6 ft opening Overtopping of streets at Q < 10% Annual Chance Even t Project Background
Update the floodplain mapping in the downtown area using HEC-RAS 2D Project It is important to be able to use the best modeling tools available! Objectives HEC-RAS 2D was a relatively new tool Limited guidance available for 2D studies
Challenges associated with using a 2D model Hydraulic structures Floodways in 2D environments Considered 2D floodway configurations including looking at (1) individual cell surcharges and (2) average WSEs at preselected cross sections Modeling Approach
After discussions with the City of Bozeman, FEMA, and DNRC, we settled on a 1D model informed by a 2D model Modeling Benefits of this approach: Approach Better conceptualized 1D model More confidence in split flows We can still model a floodway per FEMA regulations
2D Modeling General Setup The 2D area encompassed downtown Bozeman and the area to the northeast Rating curves and normal flow boundary conditions were used for outflows 1% Q = 1,007 cfs at upstream end of 2D model
General Setup HEC-RAS 5.0.3 Full Momentum Cell size 20 x 20 ft generally, 5 x 5 or 10 x 10 across main conveyance paths Eddy viscosity coefficient of 1.5 Modeled buildings with a high Manning’s n 2D Modeling Added buildings as breaklines to accurately model Manning’s n values Simulations required a small time step
2D Modeling How to model the hydraulic structures? • Modeled as bridges in 1D draft hydraulic model to account for geometry changes along each culvert and an open bottom • HEC-RAS 5.0.3 – no bridge modeling in 2D • Wormhole Culverts Introduced by a user • named Con Katsoulas on the RAS Solution forum Wormhole culverts • became obsolete with HEC-RAS Version 5.0.4
Calibration We did not have gage data or other measurements to calibrate to Structure modeling is not as advanced in the HEC-RAS 2D environment as in 1D To justify the use of wormhole culverts, we compared their performance to the bridges in the draft hydraulic model 2D Modeling
Complex split flows complicated the comparison between 1D and 2D structures Used Hydraulic Property Table (HPT) values to compare 1D structures to 2D structures 2D Modeling
Used HW, TW, and flow from 2D model culverts to pull bridge HW from 1D model HPT Very similar results for low flow (impending road overtopping) comparison since no complex flow splits Complex flow splits affect HW/TW relationship for the 1% event. More variance in comparison but still reasonable agreement. 2D Modeling
2D Modeling
2D Modeling Results • The model showed Rouse as a significant conveyance path (~190 cfs to 350 cfs) • ~70 cfs of flow was leaving the Bozeman Creek/Rouse system via Main Street • More widespread shallow flooding
1D Modeling General Model Setup • Modeled from upstream of Olive to the East Gallatin Confluence • Used the 2D model to establish reaches and flow exit/entrance points
1D Modeling General Model Setup • Added a reach down Rouse and a reach at Main Street • Tied flow into the I90 split reach
1D Modeling Split Flow Determinations • Used profile lines in 2D • Challenging accounting given the complexity of flow paths Rouse Split Church Split
Flow Split comparison between Draft and LOMR 2015 Draft LOMR Model Model Location Flooding Source Q (cfs) Q (cfs) Bogert Park Bozeman Creek 1007 1007 US of East Olive Street Bozeman Creek 839 768 US of Main Street Bozeman Creek 839 540 US of E Mendenhall Street Bozeman Creek 839 540 US of E Lamme Street Bozeman Creek 853 777 Results US end of Church Ave Split Bozeman Creek 169 239 US end of Wallace Ave Split Bozeman Creek 35 113 Rouse Ave Downtown Split Bozeman Creek No Split 355 to 189 Main Street Split Bozeman Creek No Split 71 WSE comparison between Draft and LOMR WSEs generally dropped ~0.5 feet along Bozeman Creek in downtown area Floodway comparison between Draft and LOMR Reduced FW along Bozeman Creek Added ~440 feet of FW along Rouse Avenue Added administrative FW along ~780 feet of Main Street
Results
Results
Questions and Answers
Recommend
More recommend