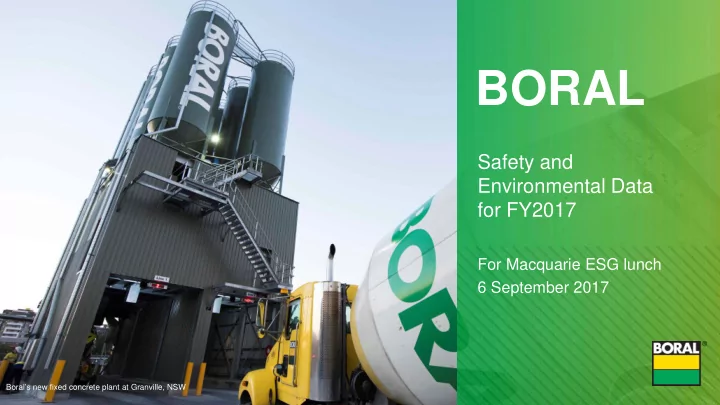

BORAL Safety and Environmental Data for FY2017 For Macquarie ESG lunch 6 September 2017 Boral’s new fixed concrete plant at Granville, NSW
Boral Group overview 1 • Boral is an international building and construction materials group with operations in Australia, North America, Asia and the Middle East • 703 operating sites • 17 countries • ~16,475 employees ~8,200 contractors • 1. Includes USG Boral and Meridian Brick joint venture operations, as at 30 June 2017 2
Safety performance Company-wide commitment to Zero Harm Today Employee and Contractor RIFR 1 • Continuing to reduce injuries in FY2017 (per million hours worked) with 8% improvement in RIFR 1 down to LTIFR 19.0 8.1 from 8.8 MTIFR 17.4 RIFR - LTIFR increased slightly to 1.5 from 1.3 - MTIFR reduced to 6.6 from 7.5 13.6 • Fatality free since Dec-2013 – the longest 12.1 -8% fatality-free period for more than 15 years 17.2 15.5 8.8 8.1 • Continued engagement throughout Boral 11.7 10.3 around our global safety goal including in 7.5 Meridian Brick & Headwaters businesses 6.6 1.9 1.9 1.8 1.8 1.5 1.3 FY12 FY13 FY14 FY15 FY16 FY17 1. Recordable Injury Frequency Rate (RIFR) per million hours worked is made up of Lost Time Injury Frequency Rate (LTIFR) and Medical Treatment Injury Rate (MTIFR). Does not include Headwaters 3
Divisional safety performance Acquired businesses are a key area of focus Employee and Contractor Divisional RIFR 1 (per million hours worked) • Meridian Brick JV underpinned FY2017 FY2016 Var, % increased RIFR in Boral North America in FY2017 Boral Australia 11.2 13.1 15% • Acquired businesses are a key area of USG Boral 3.6 3.0 18% focus • Headwaters businesses reported a Boral North America 6.7 5.2 28% 14.6 RIFR and 3.9 LTIFR for employees in FY2017 Corporate 0 0 - • Safety & environment capex allocated in Boral North America in FY2018 Boral total 8.1 8.8 8% ~US$5-$10m 1. Recordable Injury Frequency Rate (RIFR) per million hours worked is made up of Lost Time Injury Frequency Rate (LTIFR) and Medical Treatment Injury Rate (MTIFR). Does not include Headwaters 4
Safety performance Outperfoming Australian industry benchmarks Boral Australia’s Lost Time Injury Frequency Rate (LTIFR) relative to Australia industry averages 1 (per million hours worked) 8.6 8.3 8.0 1.3 Manufacturing Transport, postal Construction Boral Australia and warehousing 1. Safe Work Australia, Australian Workers’ Compensation Statistics, 2014-15, revised July 2017. Based on Safe Work Australia’s definition of LTIFR using workers’ compensation claims for injuries that resulted in 5 days or more of lost time from work. Boral Australia LTIFR of 1.3 is calculated n the same basis 5
Our GHG emissions totalled 2.50m tonnes in FY17 Boral’s emissions and emissions intensity have reduced by ~30% since FY12 GHG emissions from operations 1 and emissions intensity per A$m of revenue 2 (million tonnes of CO 2 -e) 1. Data provided for FY2017 GHG emissions and energy consumption is for Boral’s 100% owned operations and Boral’s share of emissions from 50%-owned joint venture operations. Does not include Headwaters for FY2017. 2. Revenue has been adjusted to include 50% share of underlying revenues from USG Boral and Meridian Brick joint ventures, which are not reported in Group revenues. 6
Boral’s energy and fuel exposure Energy and fuel costs make up ~7% of Boral’s overall cost base Gas usage ~9PJ 1 p.a. FY2017 1 Total Boral Boral USG Australia North Boral - Fixed term contracts: Australian east (50% share) coast contracts renew January 2018, America WA renews 2017 Gas ~2.6PJ ~2.9PJ ~3.6PJ ~9.0PJ Electricity usage ~657m kWh p.a. and total cost ~A$110m (includes Electricity ~411m kW ~128m kW ~118m kW ~657m kW ~50% fixed network costs) - ~50% of variable exposure hedged + Diesel 2 ~86m L ~8m L ~6m L ~100m L load management (off peak) strategies in place for large user sites Coal ~225k t ~1.7k t - ~227k t Diesel usage ~100m L and cost Biofuels ~0.1PJ ~0.3PJ - ~0.4PJ ~A$100m, includes ~50% fixed pump costs and taxes Total usage ~12PJ ~4PJ ~4PJ ~20PJ Gas and electricity costs in Australia expected to be Total cost ~A$197m ~US$28m ~US$47m ~A$295m ~$15m – $20m higher in FY2018 1. Includes 50% of energy usage and costs for USG Boral in FY2017 and Meridian Brick JV from 1 November 2016. Excludes Headwaters acquired business in FY2017 2. Usage data excludes owner-drivers 7
Boral 2017 Annual Review & Sustainability Report Available from 15 September 2017 8
Disclaimer The material contained in this document is a presentation of information about the Group’s activities current at the date of the presentation, 30 August 2017. It is provided in summary form and does not purport to be complete. It should be read in conjunction with the Group’s periodic reporting and other announcements lodged with the Australian Securities Exchange (ASX). To the extent that this document may contain forward-looking statements, such statements are not guarantees or predictions of future performance, and involve known and unknown risks, uncertainties and other factors, many of which are beyond our control, and which may cause actual results to differ materially from those expressed in the statements contained in this release. This document is not intended to be relied upon as advice to investors or potential investors and does not take into account the investment objectives, financial situation or needs of any particular investor. 9
Boral Limited www.boral.com.au
Recommend
More recommend