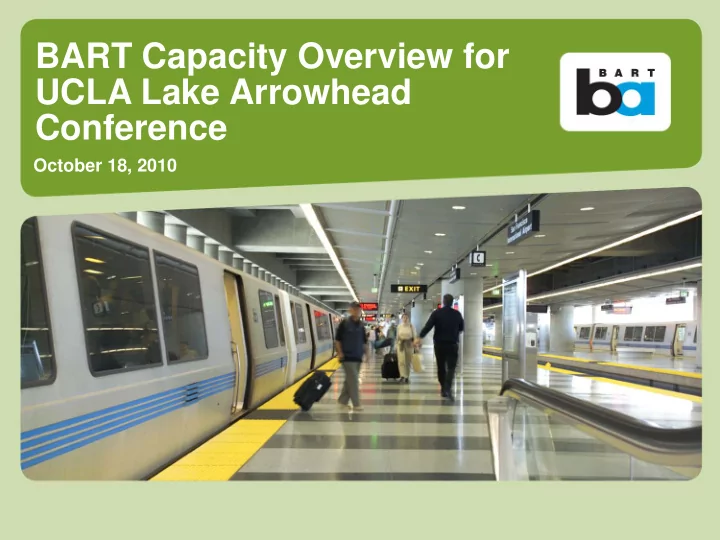

BART Capacity Overview for Click to edit Master title style UCLA Lake Arrowhead Conference October 18, 2010 0
BART Basics 360,000 daily riders 104 miles 43 stations 1.3 billion annual passenger miles 1
Transit’s Green Challenge • Regional planning focus on smart growth/sustainable communities • Expectation that transit ridership will increase as a result • Many rail systems are already experiencing capacity problems • Rail transit infrastructure requires long lead times to implement, and substantial investment to build, maintain and operate 2 2
Downtown SF Capacity Outlook • BART not out of capacity today • Near-term growth can be managed: • service adjustments • station crowd management • targeted ticket pricing measures • Long-term growth requires major capital improvements • Investments require substantial lead time • Capacity improvements unfunded • State-of-Good Repair largely unfunded 3
Priority Development Areas 4
Bay Area 2035 Forecast Growth Population 2035 • 2 million more • 37% of regional growth Oakland in SJ,SF and OAK San Francisco • 2/3 rd of regional in “Urban Core” (around Bay) Employment 2035 • 1.8 million more • Of top 10 growth areas, 2/3 rd of regional growth will be in SJ, SF and OAK 5 San Jose 5
BART Average Daily Ridership Historic Trends and Projections BART Ridership and SF Job Growth 900000 700000 2035 High: 660,000 Daily BART Riders 800000 600000 SF Jobs (1) 700000 2035 Low: 536,000 500000 600000 Daily BART Ridership SF Jobs 400000 SF Jobs ( 1) 500000 Historic BART Ridership BART FY08 SRTP (FY09 - FY16) MTC T2035 w/o Project 400000 300000 MTC T2035 w/ Project 300000 200000 200000 100000 100000 0 0 1969 1974 1979 1984 1989 1994 1999 2004 2009 2014 2019 2024 2029 2034 6 Year (1) US Bureau of Labor Statistics
SPUR Future of Downtown Report East Bay Commute is the Most Constrained Line-Haul Only 7
3500 Patrons Entering & Exiting BART (15-Minute Intervals) Where Do Patrons Enter and 3000 Exit? Embarcadero Montgomery Patrons (per 15 minute interval) 2500 2000 Civic Center 1500 Powell Balboa Park 1000 12th Street 500 0 4:00 6:00 8:00 10:00 12:00 14:00 16:00 18:00 20:00 22:00 Time of Day Source: BART DAS data, April 2008 8
BART Ridership Current Travel Markets East Bay 2/3rds of BART trips to/from Market Street stations Transbay Weekday Trips by Sub-Area • 48%: Transbay • 28%: intra-West Bay • 24%: intra-East Bay West Bay 9
Capacity Limiters • San Francisco station dwell times limit Transbay throughput • Platform and onboard crowding • Stairs and escalators • Current car design – 2 doors per side • Transbay Tube - train control system • Oakland Wye junction – conflicting movements • Lack of crossovers, turnback tracks, storage tracks 10
Transit Capacity Increases • Easier to increase capacity on bus systems quickly, but trade-offs may be operational efficiency. • Capital – buses, transit lanes/busways, bus stop improvements, maintenance facilities • Operating costs • Rail systems require much longer lead times to increase capacity. • Capital – Additional tracks, civil structures (tunnels, elevated sections), station improvements, maintenance facilities, right-of- way, vehicles, power and signaling systems • Operating costs 11
Embarcadero Capacity 12
BART in MTC Regional Rail Plan 13
BART Capital Program for Core System Major Funding Shortfalls BART Capital Program (a) ($billion) $14 $12 $10 Shortfall $8 Funded (b) $ billion $6 $4 $2 $0 Core Infrastructure Renovation Existing Fleet Replacement Capacity Modifications (a) Not shown are $30 million in Security improvements and $30 million in Quality Enhancements (b) Funding as "programmed" in MTC 2035 Regional Transportation Plan 14
Examples from Other Cities • Paris RER System – “Regional Express Metro” overlaid on top of Paris Metro system – 40+ years to develop • New York Subway – major lines built originally as 4-track lines with express train capability • US commuter rail – conversion to double deck equipment 15
JR Railway (Japan) Supply-Side Strategy 16
Capacity Overview Questions? 17
Capacity Constraints Where Could BART See Problems in the Future? • On-Board Train Crowding Passenger per Seat or per Car (Load Factors) Train Control System Vehicles • SF Downtown Stations Platform Crowding (PM) Stair, Escalator & Faregate Queuing (AM) Emergency Exiting • Yards & Shops • Station Access 18
Transbay Corridor Management Illustrative – Phased Improvements over 50 Years Short Medium Long Max. Load Point in peak direction < 2,500 2,500 – 7,500 7,500 – 12,000 (future peak hour increase) BART Remove Train Seats Demand Management Strategies Station Access Station Capacity 3-Door Train Fleet Train Control Improvements Expand Train Fleet Construct New Transbay Tube + Stations Bus Transbay Terminal Bay Bridge Contra-Flow Lane 19
BART Transit Supply Capacity Thresholds (peak hour) Preliminary Analysis Projected Peak Hour Future Capacity 2009 Actual % Additional % Additional Baseline Enhanced Constraint Ridership Growth Growth (23 trains/hr) 1 (31 trains/hr) 2 Tube (one direction) 17,750 24,600 39% 33,150 87% Embarcadero 10,000 13,000 30% 14,000 40% Montgomery 9,500 14,250 50% 15,000 58% Source: Arup, Capacity Scenarios for DMS Modeling Memo, May 19, 2009 1 23 trains / hr assumes No Delay scenario. 2 31 trains / hr assumes Delay scenario, and improved train control system 20 20
Recommend
More recommend