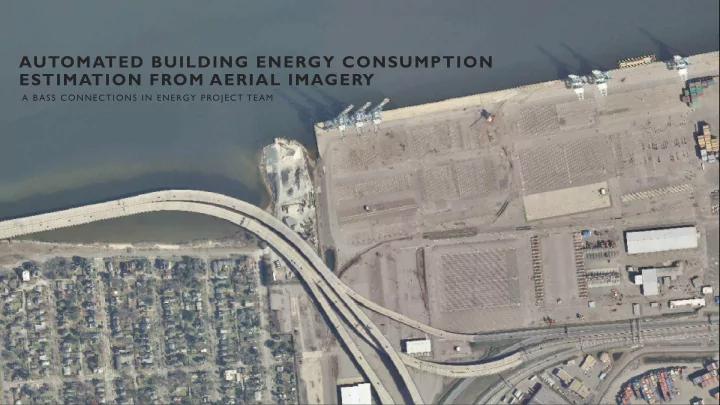

AUTOMATED BUILDING ENERGY CONSUMPTION ESTIMATION FROM AERIAL IMAGERY A BASS CONNECTIONS IN ENERGY PROJECT TEAM
Student Researchers Mitchell Kim Sebastian Lin Sophia Park Eric Peshkin Pratt ‘18 Trinity ‘18 Pratt ‘17 Trinity ‘18 T eam Members 2016-17 Samit Sura Nikhil Vanderklaauw Hoël Wiesner Yue Xi Economics ‘17 Pratt ‘18 Nicholas ‘17 Trinity ‘19 Faculty Advisors Dr. Timothy Johnson Dr. Kyle Bradbury Dr. Leslie Collins Nicholas School Energy Initiative Pratt School 2
AUTOMATED BUILDING ENERGY CONSUMPTION ESTIMATION FROM AERIAL IMAGERY A BASS CONNECTIONS IN ENERGY PROJECT TEAM
What can an image tell us about our energy consumption?
Governments and policy makers 8
Governments and Businesses and policy makers NGOs 9
Governments and Businesses and Researchers policy makers NGOs 10
Our Process 11
From a high resolution aerial image… 12
Detect building outlines and calculate their area 13
14
Use area of detected buildings for energy use estimation 15
16
17
Approach 1: Random Forests Approach 2 : Convolutional Neural Network 18
Approach 1: Random Forests Evaluate and Compare Results Approach 2 : Convolutional Neural Network 19
Approach 1: Random Forests Select Building Evaluate and Detection Compare Results Approach Approach 2 : Convolutional Neural Network 20
Approach 1: Classical Machine Learning How Can We “Teach” a Computer? Learning Feature Extraction Classification Detected Algorithm Buildings (Random Forest) 21
Approach 1: Classical Machine Learning Features: 22
Approach 1: Classical Machine Learning Features: § Color Data (HSV) 23
Approach 1: Classical Machine Learning Features: § Color Data (HSV) § Edges (Gradient) 24
Approach 1: Classical Machine Learning Features: § Color Data (HSV) § Edges (Gradient) § Variation in Pixels (STDev) 25
Approach 1: Classical Machine Learning Features: § Color Data (HSV) § Edges (Gradient) § Variation in Pixels (STDev) § T exture (Entropy) 26
Approach 1: Classical Machine Learning Features: § Color Data (HSV) § Edges (Gradient) § Variation in Pixels (STDev) § T exture (Entropy) Vegetation Detection (NDVI) § 27
Approach 1: Classical Machine Learning Shape? Decision Tree: Rectangular Non- Question: Is the pixel part of a building? Rectangular Answer: YES NO Texture? NO Smooth Coarse NO Color? Gray Green YES NO 28
Approach 1: Classical Machine Learning Random Forest Input Pixel YES YES NO YES NO Vote = YES 29
Approach II: Convolutional Neural Network 30
Approach II: Convolutional Neural Network 31
Approach II: Convolutional Neural Network 32
Approach II: Convolutional Neural Network Neural Network vs. Random Forest Classifier Features? Time? 33
Approach II: Convolutional Neural Network Our Neural Network: Overview Building Car Pool Tennis Court Building Car Pool building Court 34 Adapted From: https://www.mathworks.com/help/nnet/convolutional-neural-networks.html
Comparing Approaches: Ground truth building outlines, Building outlines detected by Building outlines detected by i.e., the ideal classification output random forest classification convolutional neural network 35
Comparing Approaches: Ground truth building outlines, Building outlines detected by Building outlines detected by i.e., the ideal classification output random forest classification convolutional neural network Misclassified building pixel "islands" 36
Comparing Approaches: Ground truth building outlines, Building outlines detected by Building outlines detected by i.e., the ideal classification output random forest classification convolutional neural network Irregular edges & merged buildings 37
Comparing Approaches: 38
Our Process 39
How good is the model? 40
How good is the model? 41
Actual Buildings and Energy Consumption Number of Buildings 388 Average Energy Use 10,237 (kWh/yr) T otal Energy - Estimation Error (%)
Actual Buildings and Actual Buildings and Energy Consumption Estimated Energy Consumption 388 Number of Buildings 388 Average Energy Use 11,977 10,237 (kWh/yr) T otal Energy 17% - Estimation Error (%)
Actual Buildings and Actual Buildings and Detected Buildings and Energy Consumption Estimated Energy Consumption Estimated Energy Consumption 388 299 Number of Buildings 388 Average Energy Use 11,977 12,405 10,237 (kWh/yr) T otal Energy 17% -7% - Estimation Error (%)
Conclusion From a high resolution aerial image… 45
Conclusion From a high Detect building resolution aerial outlines and image… calculate their area 46
Conclusion From a high Detect building Use area of resolution aerial outlines and detected buildings image… calculate their area for energy use estimation 47
Conclusion Scale up to gather this data for whole cities, with thousands of buildings, anywhere in the world! 48
Solving Murders!
And even winning awards for presenting!
THANK YOU 56
Recommend
More recommend