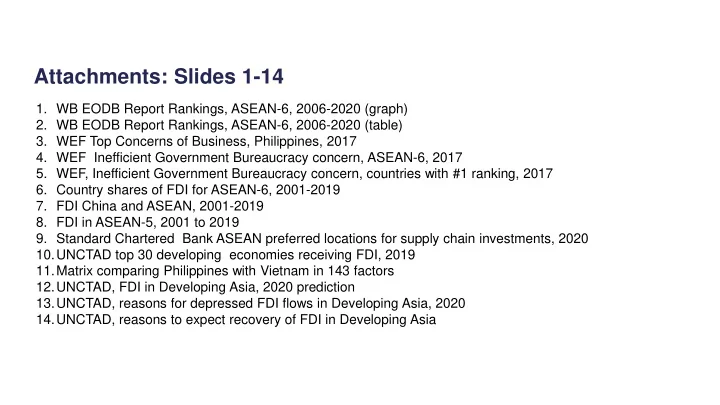

Attachments: Slides 1-14 1. WB EODB Report Rankings, ASEAN-6, 2006-2020 (graph) 2. WB EODB Report Rankings, ASEAN-6, 2006-2020 (table) 3. WEF Top Concerns of Business, Philippines, 2017 4. WEF Inefficient Government Bureaucracy concern, ASEAN-6, 2017 5. WEF, Inefficient Government Bureaucracy concern, countries with #1 ranking, 2017 6. Country shares of FDI for ASEAN-6, 2001-2019 7. FDI China and ASEAN, 2001-2019 8. FDI in ASEAN-5, 2001 to 2019 9. Standard Chartered Bank ASEAN preferred locations for supply chain investments, 2020 10.UNCTAD top 30 developing economies receiving FDI, 2019 11.Matrix comparing Philippines with Vietnam in 143 factors 12.UNCTAD, FDI in Developing Asia, 2020 prediction 13.UNCTAD, reasons for depressed FDI flows in Developing Asia, 2020 14.UNCTAD, reasons to expect recovery of FDI in Developing Asia
1. WB EODB Report Rankings, ASEAN-6, 2006-2020 (graph)
2. WB EODB Report Rankings, ASEAN-6, 2006-2020 (table) 2006 2007 2008 2009 2010 2011 2012 2013 2014 2015 2016 2017 2018 2019 2020 Indonesia 131 135 127 129 115 126 130 116 117 114 109 91 72 73 69 Malaysia 25 25 25 21 23 23 14 8 20 18 18 23 24 15 12 Philippines 121 126 136 141 146 134 136 133 86 97 103 99 113 124 95 Singapore 2 1 1 1 1 1 1 1 1 1 1 2 2 2 2 Thailand 19 18 19 12 16 16 17 18 28 26 49 46 26 27 21 Vietnam 98 104 87 91 88 90 99 98 72 78 78 82 68 69 70 Source: World Bank and authors calculations Note: N= 175 (2006-2007); 181 (2008); 183 (2009-2011); 185 (2012-2013); 189 (2014-2016); 190 (2017-2020) *2014-2020 rankings based on new methodology
3. WEF Top Concerns of Business, Philippines, 2017 Source: World Economic Forum
4. WEF Inefficient Government Bureaucracy concern, ASEAN-6, 2017 Source: World Economic Forum Source: WEF Global Competitiveness Report 2016-2017
5. WEF, Inefficient Government Bureaucracy concern, countries with #1 ranking, 2017 Source: World Economic Forum Source: WEF Global Competitiveness Report 2016-2017
6. Country shares of FDI for ASEAN-6, 2001-2019 Source: UNCTAD Total FDI inflow, ASEAN-6 2001-2019, in US$ billions 10% 15% 7% Indonesia 210.6 Indonesia 8% Malaysia Malaysia 137.8 Philippines 4% Philippines 60.7 Singapore Thailand Singapore 861.0 Viet Nam 56% Thailand 138.7 Viet Nam 146.4 2001-2019: US$ 1,555.1 billion
7. FDI China and ASEAN, 2001-2019 Source: UNCTAD 180.0 160.0 155.8 140.0 141.2 120.0 100.0 80.0 60.0 46.9 40.0 22.2 20.0 0.0 2001 2002 2003 2004 2005 2006 2007 2008 2009 2010 2011 2012 2013 2014 2015 2016 2017 2018 2019 China Total ASEAN
8. FDI in ASEAN-5, 2001 to 2019 Source: UNCTAD 100.0 80.0 60.0 40.0 20.0 0.0 2001 2002 2003 2004 2005 2006 2007 2008 2009 2010 2011 2012 2013 2014 2015 2016 2017 2018 2019 -20.0 Indonesia Malaysia Philippines Singapore Thailand Viet Nam
9. Standard Chartered Bank ASEAN preferred locations for supply chain investments, 2020
10. UNCTAD top 30 developing economies receiving FDI, 2019 Source: UNCTAD Region Country/Economy FDI inflow, in US$ millions 1East Asia China 141,225 2Southeast Asia Singapore 92,081 3South America Brazil 71,989 4East Asia Hong Kong, China 68,379 5Carribean British Virgin Islands 57,997 6South Asia India 50,553 7Carribean Cayman Islands 34,690 8Central America Mexico 32,921 Region Country/Economy FDI inflow, in US$ millions 9Southeast Asia Indonesia 23,429 16South America Peru 8,892 10Southeast Asia Viet Nam 16,120 17West Asia Turkey 8,434 11South America Colombia 14,493 18East Asia Taiwan Province of China 8,213 12West Asia United Arab Emirates 13,787 19Southeast Asia Malaysia 7,650 13South America Chile 11,437 20South America Argentina 6,244 14East Asia Korea, Republic of 10,566 21Southeast Asia Philippines 4,996 15North Africa Egypt 9,010 22Central America Panama 4,835 23Souther Africa South Africa 4,624 24West Asia Saudi Arabia 4,562 25Southeast Asia Thailand 4,146 26Southeast Asia Cambodia 3,706 27North Africa Morocco 3,559 28Central Africa Congo 3,366 29West Africa Nigeria 3,299 30West Asia Oman 3,124
11. Matrix comparing Philippines with Vietnam in 143 factors
12. UNCTAD, FDI in Developing Asia, 2020 prediction Source: UNCTAD
13. UNCTAD, reasons for depressed FDI flows in Developing Asia, 2020 Source: UNCTAD
14. UNCTAD, reasons to expect recovery of FDI in Developing Asia Source: UNCTAD
Recommend
More recommend