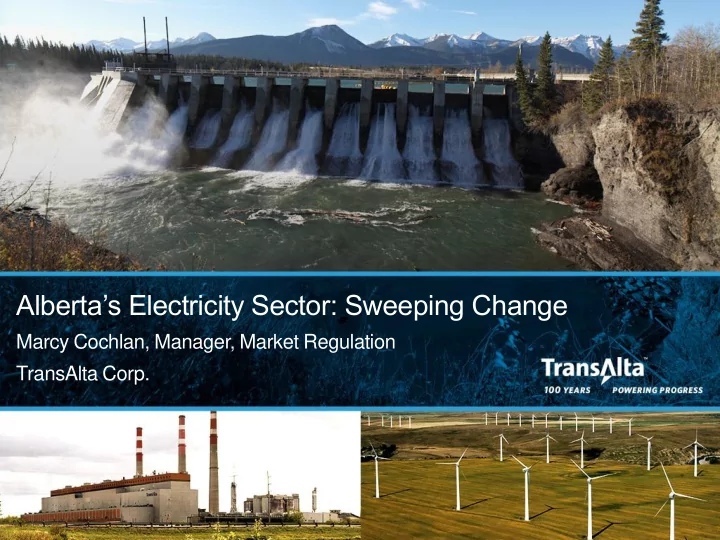

Alberta’s Electricity Sector: Sweeping Change Marcy Cochlan, Manager, Market Regulation TransAlta Corp. 1 1
TransAlta: Canada’s Largest Investor -Owned Clean Power Company • Diversified generation portfolio: wind, hydro, solar, gas and coal facilities. • Headquartered in Calgary. Leading provider of hydro in Alberta. • Leading provider of wind energy in Canada. • Employs 2,300 people in Canada, the U.S. and Australia. 2 2
Getting to 2030: What Albertan’s Need 3 3
Sweeping Change Rapid introduction of new regulations 1. Provincial carbon tax of $20/tonne in 2017, $30/tonne in 2018 • Federal government wants $50/tonne by 2022…how does this fit with Alberta’s announcement? 2. All coal-fired generation facilities in Alberta to retire by 2030 • Federal and provincial announcement 3. 30% electricity produced by renewables in Alberta by 2030 • 5000 MW of Renewable Generation subsidies with generation on-line by 2019 All of these policies pose large challenges for AB’s electricity sector and Coal Coal will result in MAJOR CHANGE 4 4
Getting to 2030: Major Transition Required 2016 2030 5 5
Getting to 2030: Massive Capital Investment Required Alberta will need 11,000 MW of new generation capacity by 2030. Requires at least $25 billion in new capital investment. Source: Multi-Client Study of Potential Impacts on the AB Electricity Market of Policy Implementation Choices for the Climate Leadership Plan (EDC Associates) 6 6
Highly Complex Challenges to be Managed Carbon Tax Raises Costs 7 7
… And it seems issues may get even more complex soon … Source: Calgary Herald, November 18, 2016 8 8
Residential Electricity Rates Across Canada Today Calgary’s electricity rates are currently amongst the lowest in Canada 9 9
Our Electricity Market is Very Unique Important differences United Alberta Texas Ontario California Germany Kingdom to consider when Energy evaluating options for Policy Assessed RPS FiT Carbon Tax FiT Efficiency Alberta Installed capacity 16,151 MW 80,149 MW 34,780 MW 78,865 MW 84,987 MW 177,140 MW (MW) Small market in terms Coal: 39% Gas: 63% Nuclear: 37% Gas: 59% Gas: 40% Coal: 28% Capacity by fuel of installed capacity Cogen: 28% Coal: 25% Gas: 29% Hydro: 18% Coal/oil: 29% Solar: 22% (Top 3) Gas: 11% Nuclear: 6% Hydro: 24% Solar: 7% Nuclear: 12% Wind: 20% % industrial load 65% 26% 25% 17% 26% 46% High percentage of coal-fired generation Recent residential 12.18 15.70 16.5 22.79 32 42.81 retail (delivered) cents/kWh cents/kWh cents/kWh* cents/kWh cents/kWh cents/kWh price ($CAD) Real Large industrial load Time Mkt Day Ahead Mkt Type of Energy-only market wholesale Tx Rights design market Capacity Mkt Relatively low retail Centrally Planned rates Note: retail prices were from spring-summer 2015, and converted to Cdn$ using 9/8/2015 exchange rate Source: EIA, ERCOT, Germany Energy Blog, Frauenhofer Institute, CA Energy Almanac, UK Government, UK DECC, Manitoba Hydro 10 10
Firm Capacity Needs and Renewable Additions 11 11
Prices Expected to Increase 300% $148/MWh 250% 200% 150% $60/MWh 100% 50% 0% Today 2030 Energy Transmission Distribution Green Subsidy • Even a well managed transition will see much higher prices • Carbon costs, subsidy costs, transmission costs, coal transition costs, replacement generation costs 12 12
Estimated Electricity Sector Emission under the Climate Leadership Plan Mt CO 2 e Source: EDC Assumptions: Coal Retires per Federal regulation until 2030, 350MW of wind added annually until 4,200 MW target reached 13 13
Percentage of Total Construction Costs Spent Locally by Technology Type 80% 70% 70% 62% 60% 60% 50% 40% 35% 35% 30% 30% 20% 20% 10% 10% 0% ► Local spend based on reported equipment and external engineering procurement costs relative to total project costs ► Source: London Economics International (LEI) with assistance from TransAlta 14 14
O&M Jobs per Megawatt by Fuel Type 0.35 0.30 0.25 O&M jobs / MW 0.20 0.15 0.10 0.05 0.00 ► Note: these O&M estimates do not include job estimates for upstream coal mining ► Source: London Economics International (LEI) with with assistance from TransAlta 15 15
TransAlta: Positioned For the Future We will continue to be a supplier of choice in Alberta TransAlta is prepared and competitively positioned to play an integral role in the future of Alberta. Growth Alberta is our Expert Energy Opportunities Base Managers _______ ________ ________ New Solar and Wind Relationships with Custom Products & Stakeholders Services Cogeneration Expertise Deep Market Flexible to Meet Knowledge Changing Needs Hydro Expansion Coal-fired to Gas Emissions Conversions Management Ensuring Alberta stays competitive. 16 16
The Right Focus = The Right Outcomes TransAlta’s Focus: Growth in Clean Energy Aggressively pursuing growth in gas and renewables to support our transition to a Clean Power Company by 2030 Accelerate Economic Recovery and Growth A “made -in- Alberta” solution that protects jobs, local investment and competitive power prices. Ensure Alberta Can Attract Future Investment Investors treated in good faith. A reasonable return on investment. All contracts honoured. Existing and new generation treated equally. System Reliability Ensure we arrive at 2030 with a strong and reliable electricity system that supports economic growth. 17 17
Questions? We’re listening! 18 18
Recommend
More recommend