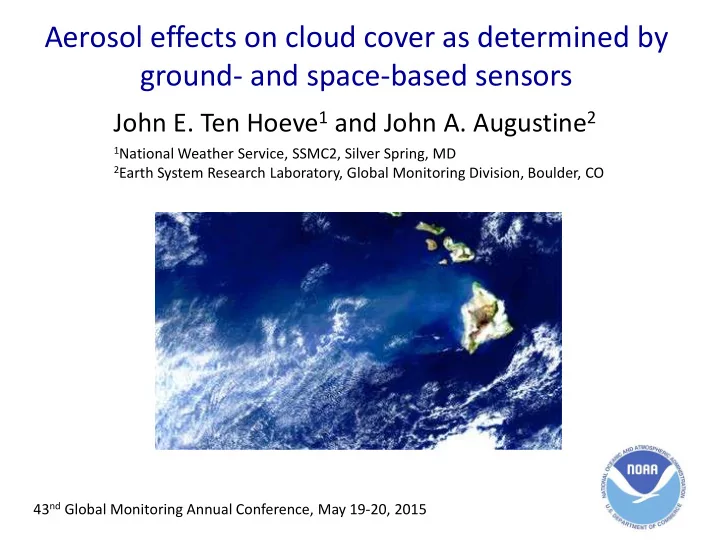

Aerosol effects on cloud cover as determined by ground- and space-based sensors John E. Ten Hoeve 1 and John A. Augustine 2 1 National Weather Service, SSMC2, Silver Spring, MD 2 Earth System Research Laboratory, Global Monitoring Division, Boulder, CO 43 nd Global Monitoring Annual Conference, May 19-20, 2015
The problem • The effect of aerosols on the extent of clouds (2 nd indirect effect) remains one of the largest uncertainties in climate science • From satellites, the detection of the collective impact of the microphysical and dynamical effects of aerosols on the macroscopic properties of clouds is possible, but… • Neither satellites nor models can resolve the microphysical processes that contribute to the cloud fraction - aerosol optical depth (f c -AOD) relationship
• Many studies have shown an increase in cloud fraction with AOD, particularly for AOD < 0.3 (beyond 0.3 AOD, the effect of AOD on cloud fraction approaches 0) • However, part of that relationship could be from confounding effects: Scattered radiation off of the sides of clouds Aerosol humidification in the cloud’s environment Cloud contamination in the AOD retrievals Vertical overlap of aerosols and clouds Meteorological covariation • It is difficult to separate out these effects with satellite data alone • We believe that surface measurements are better poised to remove some of the confounding effects
MODIS level 2 We approached AOD and cloud the 2 nd indirect fraction data effect from the top and bottom SURFRAD Desert Rock, NV
Data • 2006 through 2011 • MODIS 10-km resolution 550-nm AOD retrievals over a 50 km 2 area centered on each SURFRAD site • MODIS 5-km cloud fraction retrievals averaged over each 10-km AOD pixel • SURFRAD cloud screened 500-nm AOD, interpolated to 550-nm using the Angstrom relationship, and cloud fraction from the Total Sky Imager • AOD was restricted to values < 0.3, and only opaque cloud fractions were considered
Sun photometer measurements are sensitive to the transition zone near cloud edges • Aerosols swell near cloud edges due to humidification • There can be 3-D effects from scattered photons off of the sides of clouds
Aerosol Optical Depth Cloud screening Table Mountain SURFRAD 26 June 2014 SURFRAD solar measurements 500-nm Aerosol optical depth
Composite AOD sorted by “time-to-cloud” for all SURFRAD sites considered (2006-2011) C L O U 18 min. D E from D cloud G E 6%-11% AOD enhancement near cloud
Quantification of the 2 nd indirect effect ∆ f c / ∆τ ∆ f c / ∆τ ∆ f c / ∆τ ∆ f c / ∆τ 0.50 0.59 0.24 0.54 ∆ f c / ∆τ ∆ f c / ∆τ ∆ f c / ∆τ 0.33 0.12 0.37 Corrected f c -AOD slope is 58% of the uncorrected slope
Quantification of aerosol forcing at the surface Data used: AOD < 0.3 and corrected for near-cloud effects
Summary • All stations show cloud fraction increasing with AOD: ∆ f c / ∆τ ranges from 0.12 to 0.59, mean 0.37 (AOD < 0.3) • The cloud fraction-AOD relationship is ~42% greater when confounding effects in AOD retrievals are not removed. • Satellite data gives the same result as cloud-contaminated AODs, therefore satellite-based studies may overestimate the magnitude of the 2 nd indirect effect by ~42% • On average, aerosols over the U.S. reduce surface net solar radiation by 51 Wm -2 and surface total net radiation by 19 Wm -2 , and therefore have an overall cooling effect
Meteorological covariation Tested: Air temperature Wind speed Relative humidity RH Sea level pressure SLP
Composite Angstrom exponent sorted by “time-to-cloud” C L O U D E D G E
Recommend
More recommend