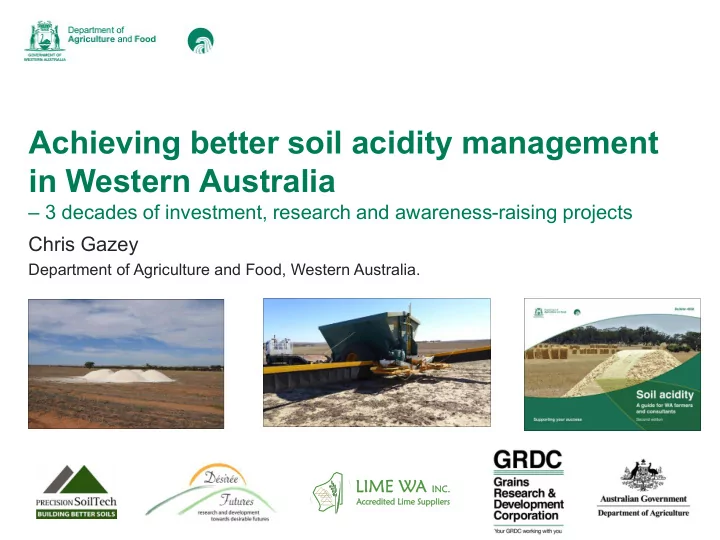
Achieving better soil acidity management in Western Australia – 3 decades of investment, research and awareness-raising projects Chris Gazey Department of Agriculture and Food, Western Australia.
Background: WA wheatbelt Dryland cropping May – Oct rainfall 225 – 450 mm Ancient, highly weathered sandy soils, generally acidic Dominant crops • wheat • barley • canola • lupin • and pasture Agricultural lime mostly coastal • 100 – 400 km
Soil acidity program • WA lime trials 15 – 20 years • Major awareness and soil testing projects 2005 – 2012 • More effective use of agricultural lime Supporting your success
Effects of soil acidity • Topsoil acidity • Reduced biological activity • Reduced legume nodulation • Reduced nutrient availability
Minimum desirable pH • Target for topsoil pH is 5.5 Ca and for subsoil pH 4.8 Ca
Soil testing projects 2005 – 2012 • Major findings • Growers’ paddocks have mirrored the control or under-limed trial treatments • 72 per cent of surface soil samples below minimum target (pH Ca 5.5) • 45 per cent of subsurface soil samples below minimum target (pH Ca 4.8) • Project and commercial samples – over 93 000 sites
Soil testing projects 2005 – 2012 • Major findings • Growers paddocks have mirrored the control or under-limed trial treatments • 72 per cent of surface soil samples below minimum target (pH Ca 5.5) • 45 per cent of subsurface soil samples below minimum target (pH Ca 4.8) • Project and commercial samples – over 93 000 sites
7. Zone of Rejuvenated Drainage • Per cent of samples below target pH Topsoil target Subsurface target pH Ca 5.5 pH Ca 4.8 % of Soil Type Zone 0 – 10 cm 10 – 20 cm 20 – 30 cm 100 74 47 40 All soils 55 87 52 41 Deep sandy duplexes 11 68 46 40 Gravels Deep loamy duplexes and 7 64 40 30 earths
Practice change Subsurface soil samples as a proportion of topsoil A coordinated approach samples collected by Precision SoilTech has created widespread awareness • growers • consultants • researchers Accelerated change in practice is happening • subsurface soil sampling • increased lime use Number of samples • 2005 topsoil n = 11240 • 2014 topsoil n = 18815
2016 soil pH for 1996 Newdegate trial Soil pH (calcium chloride) 4 4.5 5 5.5 0 10 Depth (cm) 20 30 Start 1997 nil lime 2 t/ha limestone 2 t/ha (1996) + 1.5 t/ha (2006) DAFWA, Precision SoilTech.
Agricultural lime use – Lime WA 1600 • Insufficient 1400 • 2014 – 2015 was 1.4 – 1.5 million tonnes 1200 • 70 per cent of the estimated annual lime Lime sales ('000 tonne) 1000 requirement 800 • Target • 2.5 million tonnes per year 600 for 10 years 400 200 0 4 5 6 7 8 9 0 1 2 3 4 5 6 1 0 0 0 0 0 0 1 1 1 1 1 1 0 0 0 0 0 0 0 0 0 0 0 0 0 2 2 2 2 2 2 2 2 2 2 2 2 2 Current members ~80 per cent of market share
Soil profiles? • Stratified profile • Lime typically topdressed • Often insufficient applied to raise pH adequately • development of an acidified profile • No-till farming has decreased incorporation • Separation of the lime and the acidic layers • Implications • Soil sampling • Fertiliser recommendations
WA lime trials 15 – 20 years • 2014 Barley harvest, 1996 trial at Bindi Bindi, WA • 200 km north of Perth
WA lime trials 15 – 20 years • 2014 Barley harvest, 1996 • Insufficient lime results in a declining soil pH trial at Bindi Bindi, WA profile • Detrimental effects of soil • yield penalties acidity (low soil pH) can be • deeper and more overcome but may take years severe acidity
WA lime trials 15 – 20 years • 2014 Barley harvest, 1996 • Insufficient lime results in a declining soil pH trial at Bindi Bindi, WA profile • Detrimental effects of soil • yield penalties acidity (low soil pH) can be • deeper and more overcome but may take years severe acidity
Current focus Early management of soil acidity in the surface is by far the best • A response to lime indicates that a loss has been incurred • Challenge for how to assess return on investment Tillage more than a plough for top 10 – 15 cm probably not suitable for a lot of the soil types • Rocks • Roots • Hostile subsoils on duplexes
Strategic tillage – multiple benefits • Puts lime where it is needed, creates pathways for roots • Can treat compaction • Redistributes nutrients • Ameliorates water repellence • Incorporates soil organic matter • Buries herbicide resistant weed seeds BUT • Wind erosion • Surface sealing • Toxic soil to surface • Rocks, roots... • All the usual risks which led to no-till
Deep ripped surface applied lime
Deep ripped injected lime
Canola root response Deep rip Control Surface No rip lime No lime Deep rip Injected lime
Lime incorporation – canola roots
Lime incorporation – canola roots
Topsoil incorporated behind inclusion plates
Topsoil nutrition trial results – Darkan + P Nil P + Plough - Lime + Plough + Lime Bill Bowden, Reg Lunt, DAFWA 2010 – 13 (Bruce Taylor)
How much lime – acidification rate Acidification rate is mainly influenced by two factors • N losses through leaching • product removal (harvesting) Typical acidification rates (kg lime per ha per year) • Crop – Pasture rotation 25 – 345 • Continuous crop 170 – 320 • Average 110 – 220 • 1 – 2 t/ha in 10 years for maintenance only • Up to 2.9 t/ha 10 years for maintenance only (70% NV lime)
WA agricultural lime Limesand • Perth Limestone Dolomite
Lime WA independent audits? • DAFWA independent audit • Lime WA Inc suppliers www.limewa.com.au • Calculator www.soilquality.org.au
Calculating lime requirement Measure and monitor • Soil type and starting pH profile • Enterprise – crop(s)/pasture • Productivity – removal off farm • Type of N fertiliser and how much nitrate leached • Use professional advice for recommendations which take all factors into consideration • The ‘Rule of Thumb’ can provide a guide
Our key messages for farmers • Farming acidifies the soil • Understand lime requirements across the farm – don’t apply blanket rates • Take lime quality into consideration when calculating rates and cost • Target lime to where it’s needed – treat topsoil early to prevent subsurface acidity if possible • Consider incorporation for a faster response and/or to tackle multiple constraints
Summary of WA acidity management • Extensive lime trials • Yield responses indicate acidity is a constraint to production • Awareness • Subsurface acidity • Acidification rates • Current research focus • Strategic tillage to incorporate lime • Improve return on investment (effective use of lime) • address multiple constraints to achieve and maintain multiple benefits
Acknowledgement: chris.gazey@agric.wa.gov.au GRDC projects 0429 107 976 DAW00236 & DAW00252
What is an acidic soil? Any soil with a pH below 7 • For farming purposes it is a soil with a pH low enough to have a detrimental effect on biological activity and plant • Soil acidity costs WA upto $1 billion per year • 72% topsoils below target (pH Ca <5.5) • 45% subsurface below target (pH Ca <4.8) • 68% of growers report soils acidity to be a moderate or greater problem on their farm
What is an acidic soil? Any soil with a pH below 7 • For farming purposes it is a soil with a pH low enough to have a detrimental effect on biological activity and plant • pH is a measure of the amount of acid or alkali in a solution • Importantly it is a log scale • Small changes in the number mean large changes in the concentration • Example • At pH 7 (neutral equal amounts of acid and alkali) • At pH 5 there is 10 times more acid than at pH 6 • At pH 4 there is 10 time more acid that at pH 5 but 100 times more than at pH 6
What is an acidic soil? Any soil with a pH below 7 • For farming purposes it is a soil with a pH low enough to have a detrimental effect on biological activity and plant growth
Why are our soils acidifying? • Acidification is a natural process • Ancient soils naturally acidic (most) • Accelerated under agricultural production - ‘broken’ nitrogen and carbon cycles - Leaching of nitrate - Removal of produce
Why are our soils acidifying? • Acidification is a natural process • Ancient soils naturally acidic (most) • Accelerated under agricultural More Less production - ‘broken’ nitrogen and carbon cycles - Leaching of nitrate - Removal of produce
Recommend
More recommend
Unleash a World of Digital Possibilities—Browse, Share, and Explore Content Without Boundaries