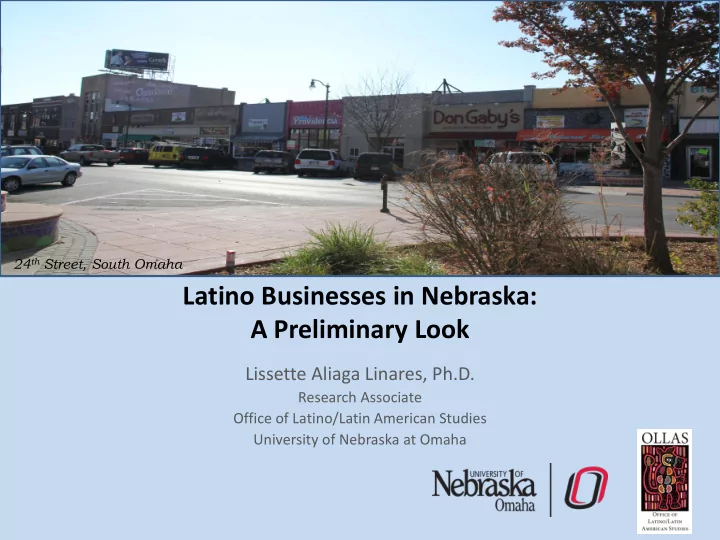

24 th Street, South Omaha Latino Businesses in Nebraska: A Preliminary Look Lissette Aliaga Linares, Ph.D. Research Associate Office of Latino/Latin American Studies University of Nebraska at Omaha
Participation in Self-employment by Race and Ethnicity for the Civilian Population 25-64 years old, Nebraska 2001-2012 100% NH Asian, 2% 98% NH Black, 2% 96% Hispanic, 4% 94% 92% NH White, 92% 90% 88% 86% 2001 2002 2003 2004 2005 2006 2007 2008 2009 2010 2011 2012 Source: Own Calculations based on American Community Survey 2001-2012, through IPUMS
Small but mighty Percent changes for the number of firms, annual sales, employment and annual payroll b y owner’s race and ethnicity, Nebraska 2002 -2007 Hispanic White Black Asian Native American 100 81% 80 56% 60 % Changes 35% 40 17% 20 0 -20 -40 Number of Firms Sales Employment Annual payroll Source: Own Calculations based on U.S. Census Bureau Survey of Business Owners 2002 and 2007- Summary Tables A1
Latino-owned establishments 2002-2006 N=359 Survival rates compared Job retention rates compared Asian Asian Missouri Missouri Black Black White White Hispanic Hispanic 59% 93% Asian Asian Kansas Kansas Black Black White White Hispanic Hispanic 63% 80% Asian Asian Black Black Iowa Iowa White White Hispanic Hispanic 78% 67% Asian Asian Nebraska Nebraska Black Black White White 95% 63% Hispanic Hispanic Asian Asian Black Black U.S. U.S. White White Hispanic Hispanic 66% 92% 0 20 40 60 80 100 0 20 40 60 80 100 Percentages Percentages Source: Own Calculations based on Special Tabulations of the U.S. Census Bureau Survey of Business Owners 2002 and 1986-2006 Business Information Tracking Series - Summary Table 4
Strong job creation through few expansions Expansion rates compared Asian Missouri • 32% of the jobs created in Black White Hispanic Latino firms during 2002- 26% Asian Kansas Black 2006 were due to White Hispanic 28% expansions Asian Black Iowa • Latino-owned business White Hispanic 28% added 10 employees per Asian Nebraska Black White expansion when the general 23% Hispanic Asian average in the state was 6. Black U.S. White Hispanic 30% 0 20 40 60 80 100 Percentages Source: Own Calculations based on Special Tabulations of the U.S. Census Bureau Survey of Business Owners 2002 and 1986-2006 Business Information Tracking Series - Summary Table 4
Some Characteristics of Latino-owned Firms in 2007 • Half opened between 2002-2007 • Low access to financial services • Only 15% are employer firms. Two thirds of employer firms have between 1 to 9 employees – More likely to hire employees in non-standard work arrangements • 54% home-based, 17% family-owned • Concentrated in four industries: – Health Care and Social Assistance (22%) – Other services (14%) – Construction (13%) – Waste Management (10%) • Cater to English and Spanish speaking communities • Low use of technology Source: “Latino Businesses in Nebraska: A Preliminary Look”
Some Characteristics of Latino- business Owners in 2007 • 35% had some level of education beyond high school • 20% had some previous experience as self-employees • 60% founded their businesses 56% provide services/ produce goods in their business • 45% had business as primary source of income • 35% were foreign born
Better Earnings from Self-employment Comparison of Personal Income Earnings by Class of Worker for Hispanic Civilian Employed Population 25-64, Nebraska 2000 and 2008-2012 2000 2008-2012* Class of worker Percent Change (in 2012 dollars) (in 2012 dollars) Self-employed $28,071 $35,876 28% Wage worker in $30,948 $28,533 -8% Private Sector Source: Own Calculations based on Census 2000 5% PUMS and American Community Survey 2008-2012 PUMS. * Difference is statistically significant at 95% level.
Some Policy Recommendations • More research! • Strengthen partnerships between organizations working with business owners and community-based organizations serving the Latino community • Increase bilingual and bicultural staff in relevant governmental offices • Create channels to more stable migratory status for business owners and immigrant population overall
Latino participation in self-employment is becoming more prominent in metro areas Source: Own calculations based on ACS-PUMS 2008-2012 and ACS Summary Tables
Recommend
More recommend