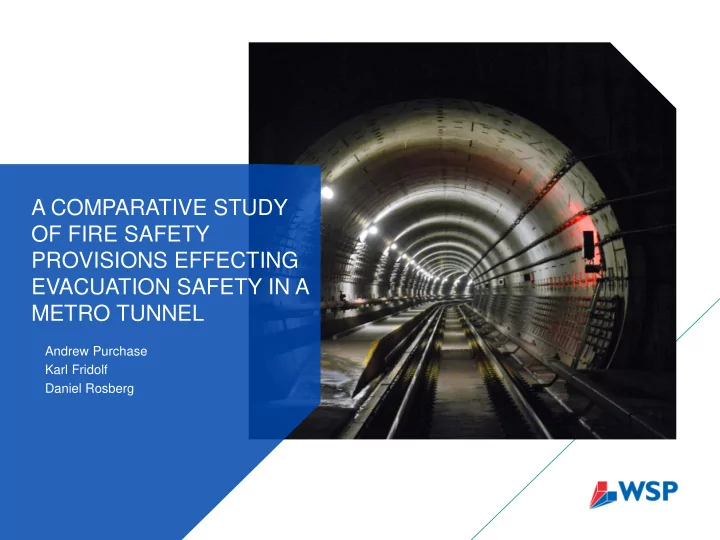

A COMPARATIVE STUDY OF FIRE SAFETY PROVISIONS EFFECTING EVACUATION SAFETY IN A METRO TUNNEL Andrew Purchase Karl Fridolf Daniel Rosberg
Background Metro tunnels Geometrically simple – a tube / box Aerodynamically complex – train movements, vent, winds, etc. Source: https://upload.wikimedia.org/wikipedia/commons/e/e9/ Stockholm_metrosystem_map.svg Accessed 2016/10/19, reproduced under CC licence CC BY-SA 3.0 Fires on trains in rail tunnels Continue to the next station Not always possible to reach station Unlikely event, but generally credible enough to design for a train fire in a tunnel Source: https://en.wikipedia.org/wiki/Tunnel#/media/File: A_crossover_on_the_south_side_of_Zhongxiao_Xinsheng_Station.JPG Accessed 2016/10/19, reproduced under GNU Licence V 1.2.
What are ‘typical’ rail tunnel evacuation provisions? Survey of tunnels around the world Some provisions are typical: Walkways with emergency lighting to assist with evacuation Regular exits once tunnels are over a Source: Author certain length Some provisions vary: Longitudinal ventilation for smoke control Walkway width: 0.7m – 1.5m Walkway elevation: track or train floor level Spacing of exits: 240m to >500m Source: Author
Why the variation in typical provisions? Many reasons, for example: Standards for a particular jurisdiction Each system has it’s own nuances Difference in opinion / perceptions of safety Driven by performance based design Maintaining a strategy within a wider system Stakeholder requirements, etc. etc. But, can be misleading / confusing when a provision is viewed in isolation Q uestion: “ Why do / don’t we have this provision? ” Other disciplines may not appreciate the implications of a change
Purpose and use What are you trying to achieve? Investigate a range of tunnel evacuation design configurations and the impact that these have on occupant safety. Focus on metro tunnels. How do you do this? Source: Author CFD and evacuation modelling with results compared on the basis of visibility and the accumulated FED regarding asphyxiates. What are the limitations? Applies only to a specific set of inputs, assumptions and engineering simplifications. How can I use this? Source: WSP Stock Photo Comparative set of results that can be used by fire safety designers when developing their own options for further assessment.
Scenario selection 12 CFD simulations, 144 evacuation scenarios
CFD modelling FDS Version 6 900m long tunnel allows for 140m long train and 500m(+) exits Two tunnel cross-sections: 22m 2 and 28m 2 free area Devices for tenability assessment – Visibility, temperature, etc. Visibility results interpreted as space (X) vs time (T) figures Snapshot of results in following slides Train 900m
Visibility – walkway elevation 22m 2 cross-sectional area, still air, 0% grade tunnel Track-level walkway Elevated walkway
Visibility – variation in tunnel grade 22m 2 cross sectional area, still air, elevated walkway 0% grade 4% grade
Visibility – longitudinal smoke control 22m 2 cross sectional area, 0% grade, elevated walkway Still air (no smoke control) Longitudinal smoke control
Visibility – walkway elevation, longitudinal smoke control 22m 2 cross sectional area, 0% grade Track-level walkway Elevated walkway
Evacuation modelling 1-D evacuation model Purpose-built for rail tunnel evacuation Developed in Perl, allows for easy scripting Allows reduction in walking speed with reduced visibility Flow rate along walkway (Lundström et al.) Flow rate along walkway with train (BBRAD) Walking speed in smoke (Fridolf et al.), = extinction coefficient Walking speed = f(crowding, flow rate, visibility, agent characteristics) Snapshot of results – see paper for more 22m 2 tunnel with 800mm walkway 28m 2 tunnel with 1200mm walkway
Maximum FIDs Highest 500m exits Elevated 22m 2 tunnel Lowest: 240m exits Track-level 28m 2 tunnel Spread varies with grade, velocity conditions, area
Number of exposures to FID ≥ 0.3 Highest 500m exits Elevated 22m 2 tunnel Lowest: 240m exits Track-level 28m 2 tunnel Spread varies with grade, velocity conditions, area
Low visibility exposures (<5m for >10 minutes) Outcomes not always clear with different velocity conditions Still air generally worse for short exit distances Airflow (forced or grade effect) generally worse for long exit distances
Total evacuation time Evacuation times increased with increasing exit spacing, reduced walkway width Longer times with elevated walkway due to reduced speed in lower visibility Improved with larger tunnel cross- section
Conclusions Outcomes likely obvious to an experienced practitioner Maybe not to stakeholders or other design disciplines In general, and specific to the modelling undertaken: Increase exit spacing, reduce walkway width ~ reduces tenability Decrease exit spacing, wider / low-level walkway ~ increases tenability Tunnel grade and tunnel area have a noticeable effect Outcomes with different velocity conditions are not always obvious So what is the ‘ best ’ configuration? Depends on the specifics of a project Perspectives: Highest level of fire safety = cost effective? Probably not. Trade- offs to arrive at an optimal solution → value in modelling
Thank you! andrew.purchase@wspgroup.se
Recommend
More recommend