
8/20/2017 1
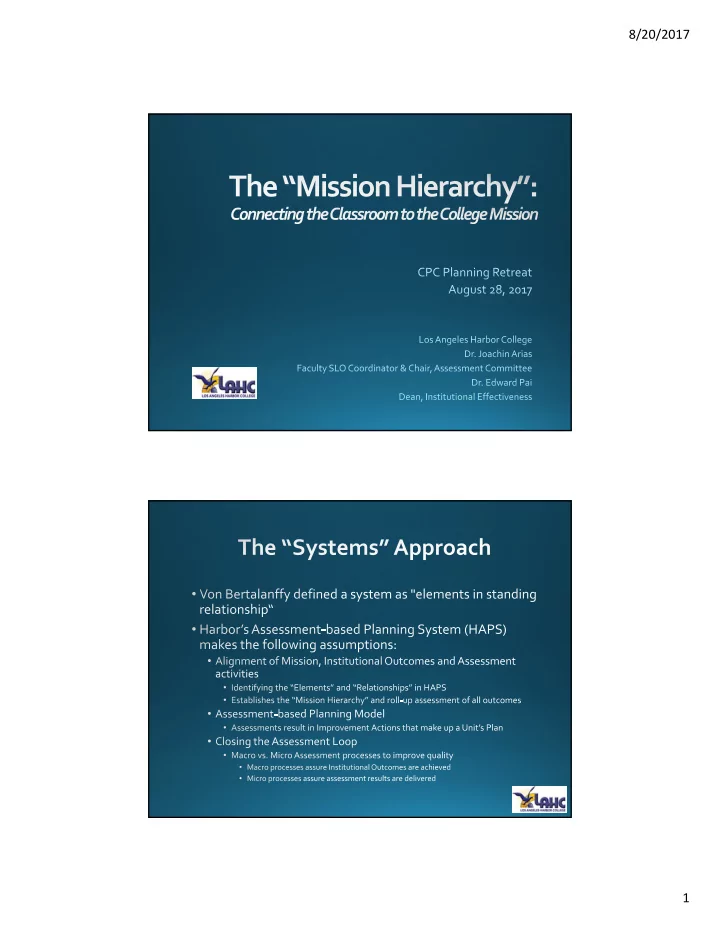
8/20/2017 “Elements” of the System Pyrami Pyr mid of of Stude Student Succe t Success (with thanks to John Wooden) Student Success / College Mission Institutional Outcomes: ISLOs: SEMP Goals: Communication, Cognition, Access & Preparation, Information Competency, Teaching & Learning, Social Responsibility Organizational Effectiveness, Resources & Collaboration Program ‐ level Outcomes: PLOs: GELOs: Service Areas: SEMP Courses in Program or Courses in a discipline Student Support Objectives / Pathways that lead to a that lead to a GE Administration Strategies degree or certificate degree/requirement Course/Service ‐ level Outcomes: SLOs: SAOs: SEMP Measures: All courses that have assigned grades and Services Area Outcomes for Student Support Student Achievement Outcomes metrics and services with a student learning component and Administrative Services standards (IEPI, SSSP, Strong Workforce), Federal, State or Grant requirements, Mission Institution Macro SEMP/Goals ISLOs Institution ‐ level Outcomes (Strategic) Program / Service Area Objectives PLOs Outcomes Micro Student Achievement and Measures SLO/SAOs Course / Service ‐ level (Operational) Learning Outcomes Outcomes Assessment ‐ based Improvement Improvement Planning → Improvement Actions Actions Action 2
8/20/2017 SEMP Learning Outcomes 3
8/20/2017 4
8/20/2017 1. Oral Communication (Fundamentals of Speech Communication) 2. Critical Thinking (PHIL 100 Logic) 3. Math Concepts/Quantitative Reasoning (STAT 108 Elementary Statistics) 4. Written Communication (First Year Reading and Composition) 5
8/20/2017 6
8/20/2017 7
8/20/2017 8
8/20/2017 SEMP Achievement Measure Standard 6 year Goal Measure Year 1 Year 2 Year 3 Year 4 Year 5 2006-07 2007-08 2008-09 2009-10 2010-11 Completion Overall 41 n/a 2.2.3 44.0% 42.1% 40.0% 38.0% 43.2% CTE Completion Rate n/a n/a 2.3.2 60.8% 58.1% 58.5% 51.8% 52.8% Fall 11 Fall 12 Fall 13 Fall 14 Fall 15 Course Completion 66.2 72 2.2.3 68.5% 66.8% 66.8% 65.9% 65.9% Degrees Awarded 797 n/a 2.2.3 544 637 805 700 887 Certificates Awarded 135 n/a 2.2.3 98 57 46 47 313 University Transfers 651 n/a 2.2.3 541 537 617 696 641 9
8/20/2017 10
8/20/2017 11
8/20/2017 12
Recommend
More recommend