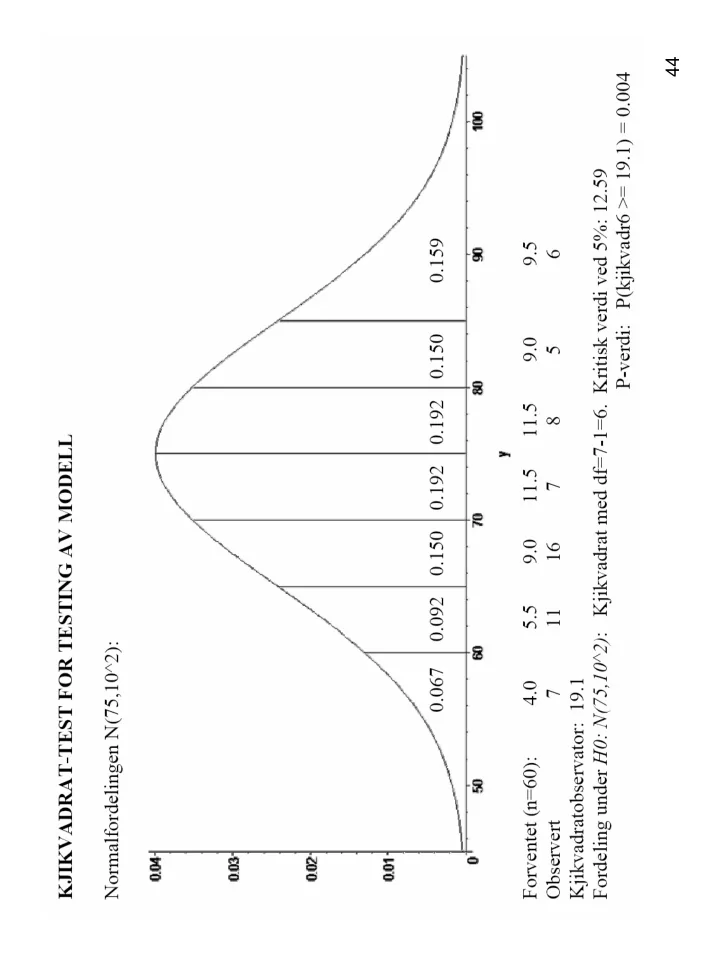

44
45
10.15 Test for independence Eye color: 1=blue, 2=brown Hair color: light blond, dark blond, dark MINITAB: Chi-Square Test: l.blond; d.blond; dark Expected counts are printed below observed counts Chi-Square contributions are printed below expected counts l.blond d.blond dark Total 1 29 12 7 48 23,40 14,40 10,20 1,340 0,400 1,004 2 10 12 10 32 15,60 9,60 6,80 2,010 0,600 1,506 Total 39 24 17 80 Chi-Sq = 6,860; DF = 2; P-Value = 0,032 46
10.16 Test for homogeneity Blood types: A, B, AB, O Populations: 1, 2, 3 MINITAB: Chi-Square Test: A; B; AB; O Expected counts are printed below observed counts Chi-Square contributions are printed below expected counts A B AB O Total 1 176 41 19 164 400 192,00 37,14 16,57 154,29 1,333 0,401 0,356 0,612 2 112 16 6 66 200 96,00 18,57 8,29 77,14 2,667 0,356 0,631 1,610 3 48 8 4 40 100 48,00 9,29 4,14 38,57 0,000 0,178 0,005 0,053 Total 336 65 29 270 700 Chi-Sq = 8,200; DF = 6; P-Value = 0,224 1 cells with expected counts less than 5. 47
Fra Gunnar Løvås: Statistikk for universiteter og høgskoler. Universitetsforlaget . Simpson’s paradox 48
49
Recommend
More recommend