2012-13 Tuition And Fees At Virginia Public Institutions Peter - PowerPoint PPT Presentation
Senate Finance Education Subcommittee 2012-13 Tuition And Fees At Virginia Public Institutions Peter Blake SCHEV Director July 24, 2012 Higher Education and the 2012 Legislative Session The 2012 General Assembly provided over $258 million in
Senate Finance Education Subcommittee 2012-13 Tuition And Fees At Virginia Public Institutions Peter Blake SCHEV Director July 24, 2012
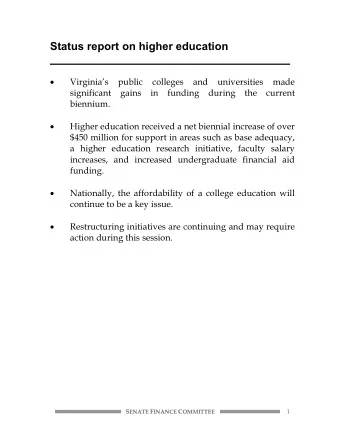
Higher Education and the 2012 Legislative Session The 2012 General Assembly provided over $258 million in additional general fund support to higher education for the 2012-14 biennium, including the following highlights for FY2013: $66.5 million for base operations, enrollment increase, STEM degrees, incentives to support TJ21 legislation, interest earnings, and other institutional initiatives. $8.4 million for need-based financial aid to Virginia undergraduate students. This represents a 5.3% increase over the FY12 level. $8.2 million for higher education research support, including research funding in Commerce and Trade. $27.6 million for affiliated agencies (VIMS, EVMS, etc.) and SCHEV (agency operating expenses, TAG, etc.) A 3% bonus on December 1, 2012. 1
Higher Education and the 2012 Legislative Session Change in General Fund Appropriations to E&G Programs in the 2012-14 Biennium 2011-12 FY13 Additions % Increase FY14 Additions % Increase General Fund 1 Inst. over FY12 over FY12 over FY12 over FY13 CNU $22,294,146 $1,448,183 6.5% $1,748,068 1.3% CWM $35,455,479 $1,097,190 3.1% $1,723,959 1.7% GMU $107,701,785 $4,992,484 4.6% $6,655,627 1.5% JMU $62,612,561 $4,459,719 7.1% $5,397,166 1.4% LU $22,022,029 $1,118,763 5.1% $1,384,974 1.2% NSU $37,768,961 $1,818,964 4.8% $2,053,837 0.6% ODU $91,185,656 $6,843,230 7.5% $7,824,612 1.0% RU $39,655,799 $2,496,436 6.3% $3,063,617 1.3% UMW $18,009,108 $1,121,555 6.2% $1,398,823 1.4% UVA $110,344,515 $3,470,242 3.1% $5,131,689 1.5% UVAW $11,317,374 $1,163,446 10.3% $1,279,836 0.9% VCU $142,388,453 $7,166,101 5.0% $9,871,149 1.8% VMI $7,429,107 $656,731 8.8% $760,105 1.3% VSU $27,994,002 $1,731,790 6.2% $1,963,084 0.8% VT $131,384,530 $3,887,079 3.0% $5,831,392 1.4% RBC $4,951,071 $291,594 5.9% $337,838 0.9% VCCS $318,848,281 $18,338,611 5.8% $22,720,895 1.3% Int. Earnings 2 $3,200,000 $3,900,000 Total $1,191,362,857 $65,302,118 5.5% $83,046,671 1.4% Notes: (1) Includes general fund appropriations for E&G and interest earnings/credit card rebates. (2) Not allocated to institutions. 2
Systemwide Fund Split of Educational and General Program Appropriations 100% General Fund 33% 33% 33% 33% 37% 42% 44% 46% 45% 46% 47% 75% 51% 59% 59% 50% 67% 67% 67% 67% 63% 58% 56% 55% 54% 54% 53% 25% 49% 41% 41% Nongeneral Fund 0% FY00-01 FY01-02 FY02-03 FY03-04 FY04-05 FY05-06 FY06-07 FY07-08 FY08-09 FY09-10 FY10-11 FY11-12 12-13 13-14 Note: FY10 and FY11 nongeneral fund appropriations include funding from the federal American Recovery and Reinvestment Act of 2009. 3
Average Funding per FTE Student at System Level In 2012-13 Constant Dollars $14,000 7.6% Total/FTE decrease since FY01 $13,055 $12,804 $12,748 $12,590 $12,000 $12,332 $12,254 $11,929 $11,768 $11,589 $11,394 $11,092 $11,071 $10,651 $10,000 53.5% NGF/FTE $8,922 increase since FY01 $8,448 $8,248 $8,000 $7,532 $7,390 $7,145 $6,778 $7,043 $7,675 $6,707 $7,448 $7,285 $6,398 $6,073 $6,838 50.3% GF/In-State FTE $6,676 $6,000 $6,442 $6,432 decrease since FY01 $5,618 $5,480 $5,249 $4,934 $5,000 $4,789 $4,438 $4,343 $4,000 $2,000 FY00-01 FY01-02 FY02-03 FY03-04 FY04-05 FY05-06 FY06-07 FY07-08 FY08-09 FY09-10 FY10-11 FY11-12 FY12-13 General Fund per In-State FTE Nongeneral Fund per Total FTE Total Funding per Total FTE Notes: (1) Appropriations, both general fund and nongeneral fund, are taken from amended Appropriation Acts. (2) General fund Includes interest earnings and credit card rebates related to Restructuring that are held in a central account. (3) FY10 and FY11 nongeneral Fund per Total FTE includes funding from the American Recovery and Reinvestment Act of 2009. (4) Total Funding per Total FTE is not the sum of General Fund per In-State FTE and Nongeneral Fund per Total FTE. (5) FY12 & FY13 are based on projected enrollments. All other years are based on actual enrollments. 4
Uses of Additional Tuition Revenue Provide funding for increases in fringe benefits. Provide funding for the operation and maintenance of new space coming online. Provide funding for increased utility costs. Increase need-based student financial aid. Provide resources to add instructional faculty and staff in response to increased enrollment. Provide funding for six-year plan initiatives. 5
Average Annual Increase of Tuition and Fees for In ‐ State Undergraduate Students 2003 ‐ 2013 25.0% 20.0% 15.0% 10.0% 5.0% 0.0% 2002‐03 2003‐04 2004‐05 2005‐06 2006‐07 2007‐08 2008‐09 2009‐10 2010‐11 2011‐12 2012‐13 Tuition and E&G fees Non‐E&G fees Tuition and all fees 2002-03 2003-04 2004-05 2005-06 2006-07 2007-08 2008-09 2009-10 2010-11 2011-12 2012-13 Tuition and E&G fees 21.5% 19.3% 10.5% 8.2% 9.9% 6.3% 6.5% 5.1% 13.1% 9.7% 4.5% Non-E&G fees 6.5% 8.5% 6.8% 7.7% 8.0% 7.6% 10.1% 5.5% 6.1% 4.6% 3.3% Tuition and all fees 15.2% 15.1% 9.1% 8.0% 9.2% 6.8% 7.8% 5.3% 10.6% 7.9% 4.1% 6 Preliminary data
2012 ‐ 13 Undergraduate Tuition and Mandatory E&G Fees (Preliminary Data) In-State Undergraduate Out-of-State Undergraduate Change over 2011-12 Change over 2011-12 Institution Charge Percent Amount Charge Percent Amount GMU $7,010 3.8% $258 $25,154 3.8% $924 ODU $5,221 3.3% $169 $20,101 3.7% $709 UVA $10,066 3.9% $382 $36,078 4.0% $1,400 VCU $7,943 4.5% $343 $21,970 4.5% $938 VT $9,250 3.9% $351 $24,242 6.0% $1,372 CWM $8,778 4.9% $413 $32,552 4.4% $1,357 CNU $6,244 5.0% $296 $15,794 4.1% $624 UVAW $4,575 5.0% $218 $18,943 5.4% $971 JMU $4,862 4.7% $220 $18,850 5.1% $918 LU $6,180 4.0% $240 $18,510 4.0% $720 UMW $6,468 5.0% $308 $18,782 5.0% $894 NSU $3,540 4.7% $160 $17,040 0.1% $17 RU $5,756 3.6% $200 $17,326 3.7% $612 VMI $6,880 3.9% $258 $26,856 4.9% $1,254 VSU $4,736 7.5% $330 $13,704 3.0% $400 RBC $3,194 5.8% $176 $13,060 3.2% $400 VCCS 1,2 $3,721 4.6% $165 $9,484 1.9% $180 Avg 4-Yr $6,501 4.4% $276 $21,727 4.2% $874 Avg All Inst $6,143 4.5% $264 $20,497 4.1% $805 Notes: (1) Northern Virginia Community College (NVCC) and J. Sargent Reynolds Community College (JSRCC) have tuition differentials in addition to the systemw ide tuition. The additional charge at NVCC is $514.50 for in-state and $594 for out-of-state students. The additional charge at JSRCC is $63 per year for both in-state and out-of-state students. (2) Other mandatory fees vary by college, ranging from $45.00 to $820.50 per academic year, and are not included in this summary. 7
2012 ‐ 13 Undergraduate Mandatory Non ‐ E&G Fees and Room and Board (Preliminary Data) Mandatory Non-E&G Fees 1 Average Room and Board 2 Change over 2011-12 Change over 2011-12 Institutions Charge Percent Amount Charge Percent Amount GMU $2,610 3.8% $96 $8,680 3.3% $280 ODU $3,229 4.4% $137 $8,547 4.0% $329 UVA $1,940 2.5% $48 $9,419 4.2% $383 VCU $1,942 1.3% $25 $8,748 1.2% $102 VT $1,673 3.9% $63 $7,254 5.8% $398 CWM $4,792 0.5% $25 $9,318 4.8% $426 CNU $4,328 4.6% $192 $9,728 2.1% $200 UVAW $3,532 5.0% $168 $9,440 6.2% $550 JMU $3,946 3.7% $140 $8,630 3.5% $290 LU $4,710 2.6% $120 $8,448 4.1% $334 UMW $2,778 5.0% $132 $8,840 4.4% $372 NSU $3,320 0.0% $0 $8,130 2.6% $203 RU $2,834 2.5% $70 $7,881 3.8% $292 VMI $6,955 6.0% $393 $7,733 3.9% $287 VSU $2,684 0.0% $0 $9,680 9.0% $800 RBC 3 $1,215 4.3% $50 $9,670 4.3% $400 VCCS $14 0.0% $0 NA N/A N/A Avg 4-Yr $3,418 3.2% $107 $8,698 4.2% $350 Avg All Inst $3,088 3.3% $98 $8,759 4.2% $353 Notes: (1) There is no difference in mandatory non-E&G fee charges by residency. (2) Charges listed here represent the w eighted average double occupancy room charge and the maximum w eekly meal plan offered, not necessarily the plan used by most students. (3) $9,670 is for room only. The college does not offer a board plan. 8
Recommend


More recommend
Explore More Topics
Stay informed with curated content and fresh updates.