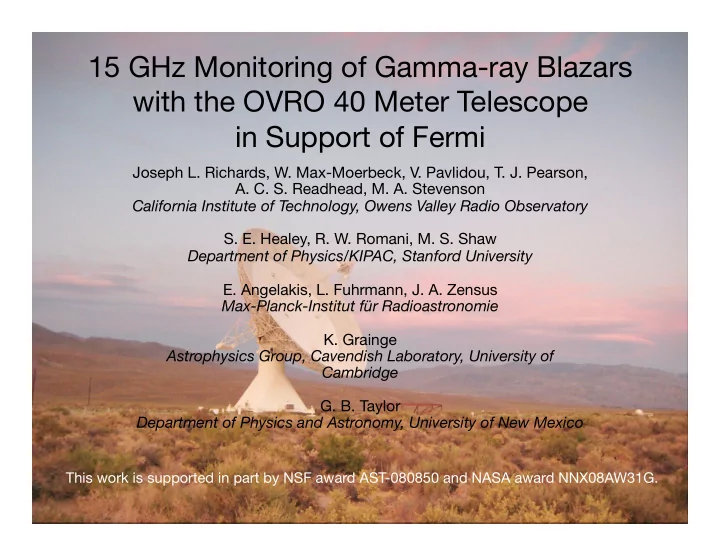

15 GHz Monitoring of Gamma-ray Blazars with the OVRO 40 Meter Telescope � in Support of Fermi Joseph L. Richards, W. Max-Moerbeck, V. Pavlidou, T. J. Pearson, A. C. S. Readhead, M. A. Stevenson California Institute of Technology, Owens Valley Radio Observatory S. E. Healey, R. W. Romani, M. S. Shaw Department of Physics/KIPAC, Stanford University E. Angelakis, L. Fuhrmann, J. A. Zensus Max-Planck-Institut für Radioastronomie K. Grainge Astrophysics Group, Cavendish Laboratory, University of Cambridge G. B. Taylor Department of Physics and Astronomy, University of New Mexico This work is supported in part by NSF award AST-080850 and NASA award NNX08AW31G.
Science • Study targets: Blazars = jet-aligned AGN – Superluminal motion, extreme variability – High apparent luminosity from radio to γ -ray • Key questions – AGN/Blazar Phenomenology • Correlation between luminosity, variability, beaming? • Correlation between wavelengths? – Time lags between flares? • Variability vs. spectral properties? • Cosmic evolution? – Jets • How accelerated? confined? collimated? • Composition? • Emission mechanism? Location? 11/4/2009 J. L. Richards ‐ Fermi Symposium 2
F-GAMMA: Project h=p://www.mpifr‐bonn.mpg.de/div/vlbi/fgamma/fgamma.html • Multi-wavelength γ -ray blazar monitoring • MPIfR (Bonn) + Caltech • Key Instruments: – MPIfR: Effelsberg 100 m, Pico Veleta (IRAM) 30 m – Caltech: OVRO 40 m • Light curves/spectra since 2007 • Also: Optical, IR, sub-mm programs Posters by W. Max-Moerbeck, L. Fuhrmann, E. Angelakis. 11/4/2009 J. L. Richards ‐ Fermi Symposium 3
F-GAMMA: Strategy • Complementary Monitoring Strategies – MPIfR: Concentrate on a “few” sources • 60 sources, hand-picked to be “interesting” • ~ monthly • 12 frequencies (2.7 – 270 GHz) – Caltech: Larger, statistically-defined sample • 1158 CGRaBS sources • ~ twice weekly • 1 frequency (15 GHz) 11/4/2009 J. L. Richards ‐ Fermi Symposium 4
OVRO 40 m Program • 1158 CGRaBS ( δ > − 20°) (~1300 total) – Selected by flat radio spectrum + radio flux + X-ray flux – FoM modeled after EGRET detections • ~ 2x per week • ~ 5 mJy noise floor • Started mid-2007 (Healey et al., 2008, ApJS, 175, 97) CGRaBS Sources 11/4/2009 J. L. Richards ‐ Fermi Symposium 5
PRELIMINARY PRELIMINARY PRELIMINARY PRELIMINARY 11/4/2009 J. L. Richards ‐ Fermi Symposium 6
Variability Amplitude I • Various standard methods exist – Do not quantify uncertainty well – Difficult to compare unless data sets uniform • Introduce intrinsic modulation index σ S m ≡ < S > • Determined from likelihood analysis – Accounts for measurement uncertainties, number of data points 11/4/2009 J. L. Richards ‐ Fermi Symposium 7
PRELIMINARY PRELIMINARY PRELIMINARY PRELIMINARY 11/4/2009 J. L. Richards ‐ Fermi Symposium 8
PRELIMINARY PRELIMINARY PRELIMINARY PRELIMINARY 11/4/2009 9 J. L. Richards ‐ Fermi Symposium
Variability Amplitude II PRELIMINARY m from likelihood analysis Intrinsic modulation index is consistent with typical modulation indices. Sample Variance Sample Mean 11/4/2009 J. L. Richards ‐ Fermi Symposium 10
Population Studies PRELIMINARY Low-z Redshift High-/Low-z Distribution Populations Hi-z PRELIMINARY BLL FSRQ vs Random Sub- BL Lac samples FSRQ 11/4/2009 J. L. Richards ‐ Fermi Symposium 11
Radio- γ Flux Correlation I • Fermi -LAT bright AGN data (Abdo et al, 2009, ApJ, 700, 597) (3-month average) • Simultaneous 3-month average radio data PRELIMINARY • Correlated, but... 15 GHz Flux Density (Jy) 10 • Method: Monte Carlo to estimate chance probability – Reshuffle data • Permute radio/ γ luminosities 1 • Apply randomly chosen z • Limit to original flux dyn. range • Evaluate correlation, repeat... – Accounts for • Red shift effects 10 100 -8 erg/s-cm 2 -erg) • Malmquist bias 100 MeV Flux Density (10 • Non-quantitative selection criteria 11/4/2009 J. L. Richards ‐ Fermi Symposium 12
Radio- γ Flux Correlation II F-GAMMA Sample Frequency Correlation P(chance) [GHz] Coefficient 142 0.89 4 × 10 -5 86 0.86 2 × 10 -5 OVRO CGRaBS Sample 43 0.83 7 × 10 -4 32 0.74 6 × 10 -4 Frequency Correlation P(chance) [GHz] Coefficient 22 0.59 1% 14.6 0.49 3% 15 0.56 5 × 10 -4 10.5 0.43 5% 8.4 0.40 6% 4.8 0.40 8% 2.6 0.43 6% • Statistically significant correlation! • Stronger with increasing radio frequency 11/4/2009 J. L. Richards ‐ Fermi Symposium 13
4 Monte-Carlo evaluated probability density PRELIMINARY PRELIMINARY 3 15 GHz 14.6 GHz OVRO F-GAMMA 2 1 data 0 0 0.2 0.4 0.6 0.8 1 r (Pearson product-moment correlation coefficient) PRELIMINARY 86 GHz F-GAMMA 11/4/2009 14
Conclusions • Two years+ radio data, good sample overlap with Fermi -LAT AGN • New intrinsic modulation index method • Statistically significant correlation of radio and γ -ray flux densities using likelihood method with simultaneous data • First 2 years data available very soon – http://www.astro.caltech.edu/ovroblazars – ~ weekly updates to begin shortly – RSS feed for updates See also M. Giroletti’s talk in the Extragalactic parallel session. 11/4/2009 J. L. Richards ‐ Fermi Symposium 15
Extra Material 11/4/2009 J. L. Richards ‐ Fermi Symposium 16
PRELIMINARY PRELIMINARY bimodality! PRELIMINARY PRELIMINARY 11/4/2009 J. L. Richards ‐ Fermi Symposium 17
Recommend
More recommend