1 entered the market. Temporary disruptions caused by events in - PDF document
FINNAIR GROUP INTERIM REPORT JANUARY 1 - JUNE 30, 2011 Turnover up 13.9%, operating result -25.2 million euros in Q2 Finnair initiates companywide structure and cost savings analysis targeting 140 million euro cut in cost base by the year 2014
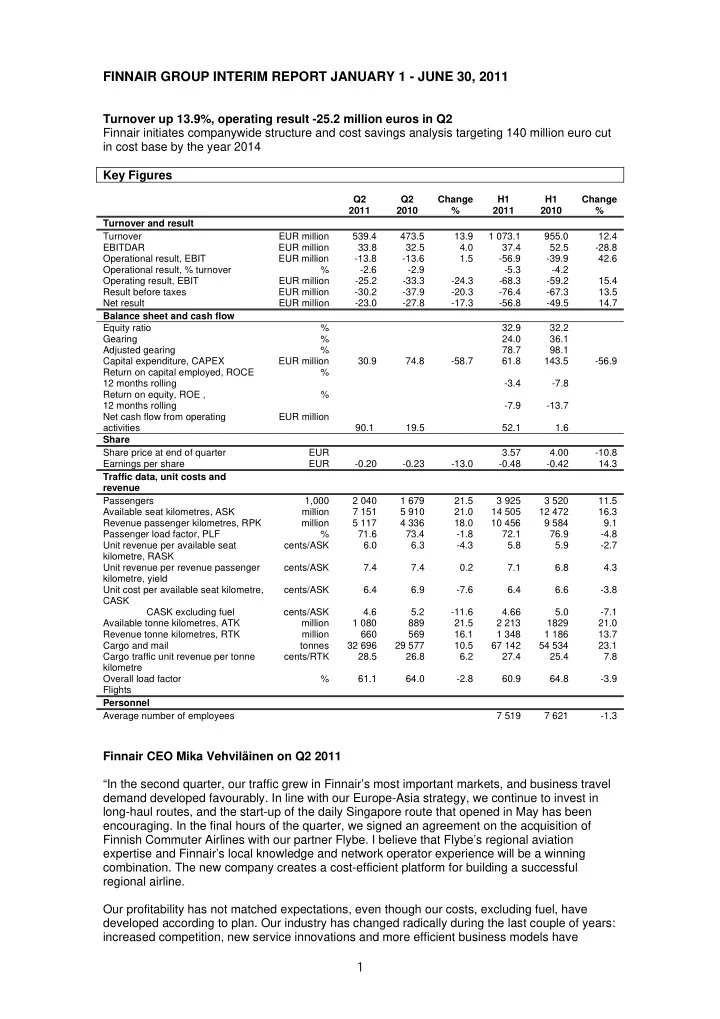
FINNAIR GROUP INTERIM REPORT JANUARY 1 - JUNE 30, 2011 Turnover up 13.9%, operating result -25.2 million euros in Q2 Finnair initiates companywide structure and cost savings analysis targeting 140 million euro cut in cost base by the year 2014 Key Figures Q2 Q2 Change H1 H1 Change 2011 2010 % 2011 2010 % Turnover and result Turnover EUR million 539.4 473.5 13.9 1 073.1 955.0 12.4 EBITDAR EUR million 33.8 32.5 4.0 37.4 52.5 -28.8 Operational result, EBIT EUR million -13.8 -13.6 1.5 -56.9 -39.9 42.6 Operational result, % turnover % -2.6 -2.9 -5.3 -4.2 Operating result, EBIT EUR million -25.2 -33.3 -24.3 -68.3 -59.2 15.4 Result before taxes EUR million -30.2 -37.9 -20.3 -76.4 -67.3 13.5 Net result EUR million -23.0 -27.8 -17.3 -56.8 -49.5 14.7 Balance sheet and cash flow Equity ratio % 32.9 32.2 Gearing % 24.0 36.1 Adjusted gearing % 78.7 98.1 Capital expenditure, CAPEX EUR million 30.9 74.8 -58.7 61.8 143.5 -56.9 Return on capital employed, ROCE % 12 months rolling -3.4 -7.8 Return on equity, ROE , % 12 months rolling -7.9 -13.7 Net cash flow from operating EUR million activities 90.1 19.5 52.1 1.6 Share Share price at end of quarter EUR 3.57 4.00 -10.8 Earnings per share EUR -0.20 -0.23 -13.0 -0.48 -0.42 14.3 Traffic data, unit costs and revenue Passengers 1,000 2 040 1 679 21.5 3 925 3 520 11.5 Available seat kilometres, ASK million 7 151 5 910 21.0 14 505 12 472 16.3 Revenue passenger kilometres, RPK million 5 117 4 336 18.0 10 456 9 584 9.1 Passenger load factor, PLF % 71.6 73.4 -1.8 72.1 76.9 -4.8 Unit revenue per available seat cents/ASK 6.0 6.3 -4.3 5.8 5.9 -2.7 kilometre, RASK Unit revenue per revenue passenger cents/ASK 7.4 7.4 0.2 7.1 6.8 4.3 kilometre, yield Unit cost per available seat kilometre, cents/ASK 6.4 6.9 -7.6 6.4 6.6 -3.8 CASK CASK excluding fuel cents/ASK 4.6 5.2 -11.6 4.66 5.0 -7.1 Available tonne kilometres, ATK million 1 080 889 21.5 2 213 1829 21.0 Revenue tonne kilometres, RTK million 660 569 16.1 1 348 1 186 13.7 Cargo and mail tonnes 32 696 29 577 10.5 67 142 54 534 23.1 Cargo traffic unit revenue per tonne cents/RTK 28.5 26.8 6.2 27.4 25.4 7.8 kilometre Overall load factor % 61.1 64.0 -2.8 60.9 64.8 -3.9 Flights Personnel Average number of employees 7 519 7 621 -1.3 Finnair CEO Mika Vehviläinen on Q2 2011 “In the second quarter, our traffic grew in Finnair’s most important markets, and business travel demand developed favourably. In line with our Europe-Asia strategy, we continue to invest in long-haul routes, and the start-up of the daily Singapore route that opened in May has been encouraging. In the final hours of the quarter, we signed an agreement on the acquisition of Finnish Commuter Airlines with our partner Flybe. I believe that Flybe’s regional aviation expertise and Finnair’s local knowledge and network operator experience will be a winning combination. The new company creates a cost-efficient platform for building a successful regional airline. Our profitability has not matched expectations, even though our costs, excluding fuel, have developed according to plan. Our industry has changed radically during the last couple of years: increased competition, new service innovations and more efficient business models have 1
entered the market. Temporary disruptions caused by events in Japan and the Middle East as well as a substantial increase in the oil price have naturally contributed to the weakening of financial performance. Especially the Japanese natural disaster had a significant impact on our result in the second quarter. The situation faced by our mainline business, particularly European feeder traffic, is challenging. In the long term, our cost structure compared with many of our competitors is simply unsustainable. In order to build a sustainable future Finnair, we must improve our operational efficiency. We are now therefore seeking a permanent reduction of 140 million euros in our cost level by the year 2014. We will begin the planning of these savings and initiate discussions with personnel group representatives. It’s clear that performance improvement of this magnitude will require new thinking, a significant change in ways of working and operational structures as well as dissection of all cost items. Our structures and ways of working are based on a legacy from a different era and no longer work in our current environment. As reported earlier, we are aiming to find a new operating structure in our Catering business in cooperation with an industry partner. Similarly, we must explore possible structural changes in other areas with an open mind. We will also have to analyse various structural solutions with respect to flight operations, particularly in European traffic. At the same time, our goal is not only to cut costs, but to grow and to improve our financial performance sustainably. We aim to double our turnover in Asian traffic by 2020. We are continuously analysing new opportunities in Asia to strengthen the cornerstone of our strategy. Next year, we will become the first European airline to open a route to China’s largest city Chongqing, which is investing strongly in industry, international trade and tourism. Finnair is also focusing on customer service and the fluency of traffic flow at Helsinki-Vantaa, which is the key gateway for our Asian and European traffic. Our service excellence received recognition when The World Airline Awards named Finnair the Best Airline in Northern Europe 2011 in connection with the Paris Air Show. In addition to traffic growth, we are also developing opportunities in order to increase ancillary sales to deliver added value to our customers. Due to Asian economic growth, our cargo business is also presenting us with new growth opportunities, which we will seek to exploit in line with our ambitious targets. I believe that our strategy gives us a strong foundation for building a new Finnair with our personnel and partners. We will share our future plans in the coming weeks and months as planning work proceeds in our business units. Our objective is clear: we want to create a profitable Finnair which is able to invest in its future.” Business environment and development of Finnair’s flight operations The strong growth in demand evident in the first quarter levelled off in the second quarter due to the continued high price of oil, the uncertain macroeconomic situation, and events in Japan, the Middle East and North Africa. Finnair was able to exploit the situation by increasing its market share in traffic between Europe and Asia; the company is now the third largest airline in the markets served by the company, as measured in revenue passenger kilometres (RPK). Finnair has increased its capacity in Asian traffic in accordance with its strategy: in May, the company began daily direct flights to Singapore. The route has made an encouraging start. Business travel and business class demand developed positively, but euro market uncertainty, weakness of demand in travel to Japan, and unrest in the Middle East and North Africa impacted negatively on the development of unit revenue (RASK), which fell by 4.3%. Excluding fuel, Finnair’s costs have developed according to expectations. Fuel hedging gains were 24 million euros in April-June and 36 million euros for the first half. According to the Finnair hedging policy, the degree of hedging in July-September is 73%. Due to the price of fuel and the disruptions of the early part of the year, Finnair recorded a loss in the second quarter, in line with earlier profit guidance. 2
Recommend


More recommend
Explore More Topics
Stay informed with curated content and fresh updates.