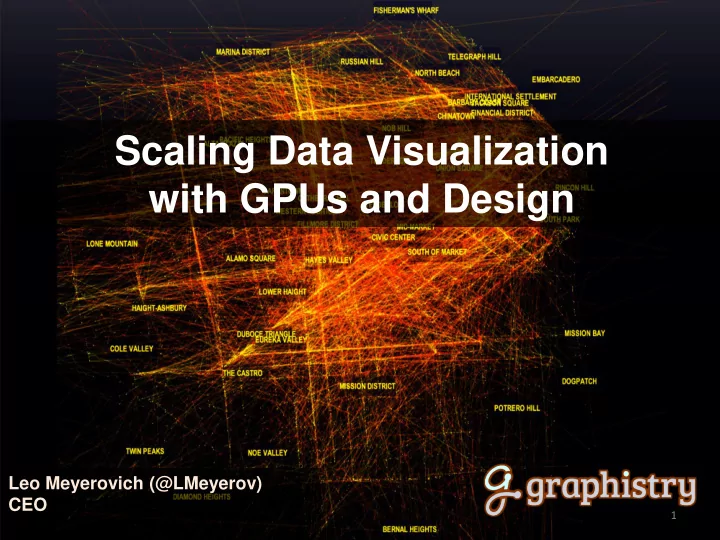

Scaling Data Visualization with GPUs and Design Leo Meyerovich (@LMeyerov) CEO 1
is: Supercharging visual analytics through GPU cloud streaming. (We tricky graphs.)
The Future of Visual Analysis 3
Not the Future We Were Promised 4
Ballot Boxes: 100K rows x 30 col CSV 5
Stack Towns by Voter Turnout ballot box stuffing? # Towns Most towns had ~40% people vote 0% 25% 50% 75% 100% Voter Turnout 6
7
Tiny square shows town size (area) and vote (color) Incumbent Opposition 8
Filter for towns w/ high turnout 9
Tag suspicious with black 10
Analyze suspicious activity in context What parts of the supply chain were hit? 11
A slider is worth a hundred queries. 12
A slider is worth a hundred queries. Challenge: Tools must keep pace with human ingenuity: interact meaningfully and quickly 13
DEMO: The Power of Meaningful Layouts
On a small graph (77 nodes), meaningful design adds some clarity
CASE STUDY: Node: Twitter account Edge: Friendship TWITTER FRAUD Friends and friend-of-friends of a bot who randomly messaged real people and retweeted them. Naïve layout on 1K+ node graphs give impenetrable hairballs. Gauss-Seidel Force-Directed Graph, O(N^2) n-body, GPU
The spambot is an entrypoint to more bots… With smart layouts, fake account clusters pop out ForceAtlas2 Layout, O(n log n) n-body, GPU
A quiet small business who buys virtual game currency from gamers…
Who somehow got exactly 1 message massively trended & advertised by Twitter
It’s a “ retweet laundering” botnet! Tricks Twitter into targeting gamers to check out a cyberfraud site. They steal gamers’ money and identities. bot retweet network laundering accounts spammer
DEMO: GPUs Enable Exploration
Uber Trips through SF Start to End 22
Connecting the Dots: OVERPLOTTED! 23
Edge Bundling Reveals Arteries Uber Trips through SF Start to End 24
Edge Bundling Reveals Arteries Uber Trips through SF Start to End … But too slow to filter on time, location, demographics, … 25
Edge Bundling Reveals Arteries Uber Trips through SF Start to End DEMO: GPU Acceleration 26
Under the Hood: Architecting for GPU Cloud Streaming & Benchmarks
Thin/Thick is Dead. Home: broadband multicore + GPU multicore + GPU Office: GigE Build thick/BIG.
Architecting Visual Analytics around thick/BIG (GPU Cloud Streaming) compressed geometry (VBO) multicore encoder multicore decoder rendering engine layout & analytics zoom, drag, cluster, filter, mouseover , … summarize, … Portable & predictable. Scalable.
Explore 15X More Data, 60X Faster 100 Frames per (thick/big) second 15X+ bigger data 10 10 interactivity threshold 60x faster 1 (multicore) 0.1 500K 1.0M 1.5M Graph Size: # Nodes + # Edges Graphistry streaming from AWS G2 Gephi on 2014 MacBook Pro Multiple SNAP datasets
Region by pop. GPUs RAM TFLOPS Cost* SF 1 4GB 2 $0.06/hr *Calculated as $0.60/hr AWS G2 instance / 10x timesharing
Region by pop. GPUs RAM TFLOPS Cost* SF 1 4GB 2 $0.06/hr Bay Area 10 40GB 20 $0.60/hr *Calculated as $0.60/hr AWS G2 instance / 10x timesharing
Region by pop. GPUs RAM TFLOPS Cost* SF 1 4GB 2 $0.06/hr Bay Area 10 40GB 20 $0.60/hr California 100 400GB 200 $6.00/hr *Calculated as $0.60/hr AWS G2 instance / 10x timesharing
Region by pop. GPUs RAM TFLOPS Cost* SF 1 4GB 2 $0.06/hr Bay Area 10 40GB 20 $0.60/hr California 100 400GB 200 $6.00/hr America 1000 4TB 2 PFLOPS $60.00/hr … less than even one consultant … *Calculated as $0.60/hr AWS G2 instance / 10x timesharing
New era is thick/BIG: GPU cloud streaming. Code less, explore more. 35
We’re Hiring! Infoviz & frontend (and contact for info on using/embedding) info@graphistry.com Twitter: @LMeyerov 36
Recommend
More recommend