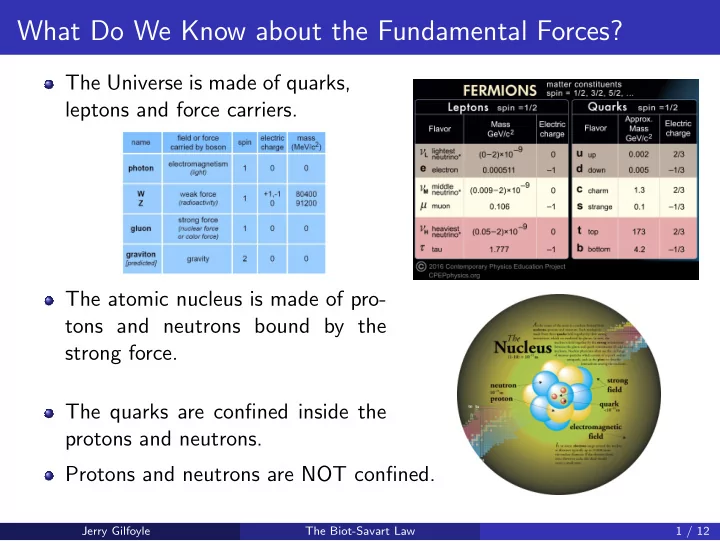

What Do We Know about the Fundamental Forces? The Universe is made of quarks, leptons and force carriers. The atomic nucleus is made of pro- tons and neutrons bound by the strong force. The quarks are confined inside the protons and neutrons. Protons and neutrons are NOT confined. Jerry Gilfoyle The Biot-Savart Law 1 / 12
The Electric and Magnetic Fields dq ˆ d � r E = k e r 2 Jerry Gilfoyle The Biot-Savart Law 2 / 12
The Electric and Magnetic Fields dq ˆ d � r E = k e r 2 d � B = k m Id � s × ˆ r r 2 Jerry Gilfoyle The Biot-Savart Law 2 / 12
The Magnetic Field of a Current Loop Consider a circular loop of radius R located in the y − z plane and carrying a steady current I . What is the magnetic field at an axial point P a distance x from the center of the loop in terms of I , R , x , and any other constants? I R P x Jerry Gilfoyle The Biot-Savart Law 3 / 12
The Magnetic Field of a Current Loop Jerry Gilfoyle The Biot-Savart Law 4 / 12
How the Sensor Works - The Hall Effect Jerry Gilfoyle The Biot-Savart Law 5 / 12
How the Sensor Works - Electric Current Jerry Gilfoyle The Biot-Savart Law 6 / 12
Fitting the Data In the plot above the value of the y -intercept is kept at its best fit value and the slope is varied. The estimated variance is the following. � N i =1 ( y i − ( mx i + b )) 2 σ 2 = N − d . o . f where N is the number of data points and d . o . f is the number of degrees of freedom ( i.e. free parameters) in the fit. Jerry Gilfoyle The Biot-Savart Law 7 / 12
Using the Reduced χ 2 The χ 2 and reduced χ 2 are pA → e + e − X N (( y i − f ( x i )) 2 χ 2 = � σ 2 i i =1 and χ 2 reduced χ 2 = N − d . o . f where N is the number of data points. In Mathematica the esti- mated variance is equal to the re- duced χ 2 if the proper weighting is used. R. Muto et al. , Evidence for In-Medium Modification of the φ Meson at Normal Nuclear Density , Phys. Rev. Lett., 98 , 042501 (2007). Jerry Gilfoyle The Biot-Savart Law 8 / 12
Using the Pasco Hall Probe Jerry Gilfoyle The Biot-Savart Law 9 / 12
Biot-Savart Results Magnetic Field of a Current Loop 0.00025 Green - Dashed: Predicted 0.00020 Blue - Solid: Fit, n = 1.51 ± 0.02 Red: Data 0.00015 B ( T ) 0.00010 0.00005 0.00000 0.00 0.05 0.10 0.15 0.20 r ( m ) Jerry Gilfoyle The Biot-Savart Law 10 / 12
Averaging a Data Range in Capstone Zoom in on the data range of interest. Click on Highlight Region in the Capstone menu bar and use the box to select the data range. See the figure. Click on Selected Statistics . Check Mean , and Standard Deviation . The results will be displayed at the left in the plot. To change the output format in the statistics Selected Statistics box, see the next slide. Highlight Region Jerry Gilfoyle The Biot-Savart Law 11 / 12
Changing the Statistics Format in Capstone Go to Workbook in the Capstone menu bar and select Show Tools Palette . Click Data Summary on the left. Click on the Show Sensor Data tab if it’s not visible. Click on the measurement you are working on and want to change. Click on the gear wheel icon to the right to select Properties . The Properties window will appear. Click Numerical Format and set the desired properties. Jerry Gilfoyle The Biot-Savart Law 12 / 12
Recommend
More recommend