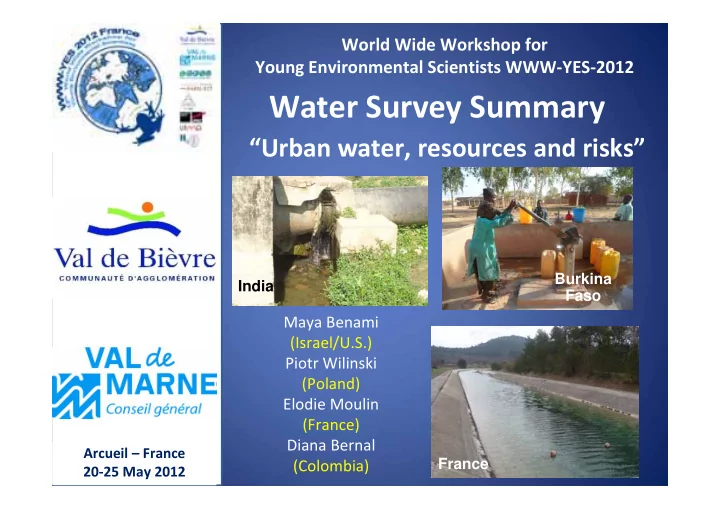

World Wide Workshop for Young Environmental Scientists WWW ‐ YES ‐ 2012 Water Survey Summary “Urban water, resources and risks” Burkina India Faso Maya Benami France (Israel/U.S.) Piotr Wilinski (Poland) Elodie Moulin (France) Diana Bernal Arcueil – France (Colombia) France 20 ‐ 25 May 2012
WWW-YES 2009-2012 – Participants and surveyed cities WWW-YES 2009 – 2012 in numbers • 84 cities surveys (>50 countries, 5 continents) • Inhabitants from 435 Ikare – to 17 500 000 Cairo Teheran - Iran
Water resources Survey 2009-2012 - Curiosities 40% rain water – Singapore Ibadan (Nigeria) – only Fada N’Gourma – Burkina Faso 22% demand of water fullfilled Zahle - Lullea – Sweden Lebanon
Water resources – 2012 ” Uses 100% desalinated seawater from the sea and groundwater” – Plant in Eilat Maya Benami Israel, Eilat City Surface water from Malaysia, rain water from Singapore, sea water, treated wastewater -Singapore Lucknow - India Sidney - They use : Dams + Recycling + Desalination + Water efficiency = Water 4 life.”
Water distribution • Lucknow, India – water supplied 2h/d • Buga, Colombia -38% water loss in distribution system (decresed during last 10 years from 43%) • Europe– people started collect rainwater for watering • Cairo, Egypt – some people stay in queue to get the access to public wells • Lebanon – 79% people connected Years 2009 - 2012 to the network (41% Hermel, 93% Beirut) • Ziguinchor, Senegal – water becomes saltier because of drought
Company or institution delivering the water Start of water delivery (all years) > 100 years 100 years<y<50 years 50 years<y<10 years < 10 years 24% 23% 42% 11% Italy-Cagliari-Drinking-water-plant-of-Corongiu-Foddis
Water price (€/m 3 ) North Europe America Asia 0.65 – 3.9 0 – 0.4 0 – 5 Median : Median : Median : 2.3 0.25 0.13 Central and Africa South 0.07 – 46 America Median : 0.12 – 2.6 0.45 Median : 0.51
Percentage of household income spent for water 0.3% - 2% 0.5% – 25% 4% 0.8% - 5% 0.6% Minimun Maximun Africa El Hencha (Tunisia) Bizerte (Tunisia) Asia Nagpur (India) 22,5 (Tajikistan) Europe Marseille (France) Lyon (France)
Key problems of drinking water ‐ 2012 Distance between Discontinuity of Water quality Water price source and delivery and sanity household � Ikare, Ondo � Ikare, Ondo � Lucknow State (Nigeria) � Bizerte State (Nigeria) � Dushanbe (India) � Dushanbe (Tunisia) � Marseille (Tajikistan) � Lucknow (Tajikistan) � Lucknow (France) � Lucknow (India) (India) � Nagpur (India) (India) � Shoushtar � Tehran (Iran) (Iran) Others problems: • Buga (Colombia) – Losses in distribution system • Eilat (Isarael), Nagpur (India) - Leaks in the piping • Tehran (Iran) – Nitrate problems
COKE BOTTLE (€/L) / AVERAGE WATER PRICE (€/L) 300 - 1000 1000 – 300000 (Tajikistan) 500 - 3000 300 2000
Water Price and Other Key Water Problems However, 2012 participants • • Over the years the report problems with: average participant Nitrate contamination (Iran) • stated on a scale of 0 ‐ 3 • Contaminated groundwater a 1.1, indicating that (India) the water price is not a • Water losses during major problem (yet). distribution (Columbia and Israel) • Except in places such as France and Israel (stated from 2012 participants)
Opinion of Participants on water privatization: “should water be public?” Year Private Public • Reasons for public ownership: 2009 ‐ 2012 22% 78% • Water is a common good • Social equity • Control of water price • Control of corruption • Guarantee of safe drinking water • Control of corruption transparency of management For those who say “privatize!”: Case Studies on water privatization: Cochabamba, Bolivia; the Thatcher regime in the UK, and South Africa. For those who say “keep it public”: ask yourselves why to privatize in the first place, i.e., governments need money, companies can provide better services?
Question: Should Question: Should drinking w ater be citizens be involved in free? w ater m anagem ent? Year Yes No Year Yes No 2009 ‐ 2012 93.4% 6.6% 2009 ‐ 2012 42% 58% Quote from Ahmed Al-Rubaei from Iraq, who thinks that drinking water should not be free because: “Water is too valuable, so it should not be free to reduce the loss of water and also to conserve it.”
Women involved in housework (water acquisition in particular) Women’s % 2012 Participant country importance home in water acquisition More than 50% 100 % Nigeria Burkin India a Faso (2) 4 Tunisia Iran Poland 3 France 2 Tunisia Iran Iran 1 Tajikistan Colum Less than 50% bia 0 Israel From Temitope Oyedotun, Nigeria: “Women are the ones going to fetch the water - it is generally viewed as a woman’s role in the city“
Type 2 0 0 9 -2 0 1 2 Men W om en W ater Delivery Director 9 6 % 4 % Local Service Director 9 6 % 4 % From Mukta Chandel, India: “There is a need to consider why the gender issues exist: women and men both have Mary Drikas - the water industry in different priorities for water.” Australia.
CONCLUSIONS � 84 cities surveys (>50 countries, 6 continents) � Water Resources: � Dams/lakes, groundwater, sea, river, rainwater � Water Delivery: mostly publicly owned � Water price: 0 (Montreal) - 2 (Paris) - 46 Euros/m 3 � Percentage of household income spent for water : 0.3% in Europe and 25% in Tajikistan � Key water problems – Discontinuity of delivery, water quality and sanity and water price � Should water be public? � Gender issues � Population + Price + Scarcity + Sewage/Sanitation � Merci !!
Recommend
More recommend