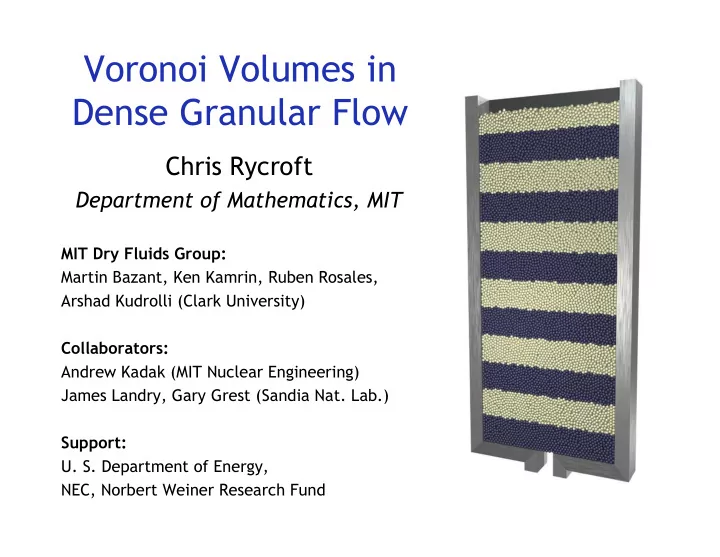

Voronoi Volumes in Dense Granular Flow Chris Rycroft Department of Mathematics, MIT MIT Dry Fluids Group: Martin Bazant, Ken Kamrin, Ruben Rosales, Arshad Kudrolli (Clark University) Collaborators: Andrew Kadak (MIT Nuclear Engineering) James Landry, Gary Grest (Sandia Nat. Lab.) Support: U. S. Department of Energy, NEC, Norbert Weiner Research Fund
Free volume in dense amorphous materials Vacancy Spot model for Void model for mechanism random packing granular drainage for flow in dynamics (Bazant, (Litwiniszyn, 1963, viscous liquid Mechanics of Mullins 1972) (Eyring, 1936) Materials , 2005)
Measuring packing fraction using Voronoi volumes • Investigate changes in packing fraction at the scale of a spot • Voronoi cell: the region of free space closer to a particle than any other • Packing fraction defined as the ratio of a particle volume to its Voronoi cell • Averaged over particles in a small region
Measuring packing fraction using Voronoi volumes • Investigate changes in packing fraction at the scale of spot • Voronoi cell: the region of free space closer to a particle than any other • Packing fraction defined as the ratio of a particle volume to its Voronoi cell • Averaged over particles in a small region (Three dimensional Voronoi cell network)
Two simulation methods • Simulation 1: Discrete Element Method (DEM) – Parallel code (Sandia) – Realistic friction model • Simulation 2: Spot Model – Based on spot model mechanism – Use initial packing from DEM – Calibrate free parameters from DEM – See cond-mat/0602394 (55000 particles in a container of dimensions 50d x 8d x 110d)
Comparison of density changes 70% 60% 50 % (Spot Simulation) (DEM simulation) (Spot Simulation) (DEM simulation) Simulation snapshots Voronoi density plots
3D Cylindrical container • Simulations of a pebble-bed nuclear reactor • 400,000 particles • Continuously cycled • Two pebble types 30 ° exit funnel 60 ° exit funnel (See cond-mat/0602395)
Packing fraction in the reactor simulation • Packing defects propagate far down into the packing • Sharp crossover to a lower density region near orifice 30 ° exit funnel 60 ° exit funnel
Conclusion • Consistent with predictions of shocks from plasticity theory • But simulations show continuous velocity profiles • Sharp elastic/plastic transition (Time averaged plots) See http://math.mit.edu/dryfluids for papers, movies, and more information
Examples of algorithm results Cross section through Corner boundary a thin container condition
Complicated boundaries Looking up from below at a funnel
Recommend
More recommend