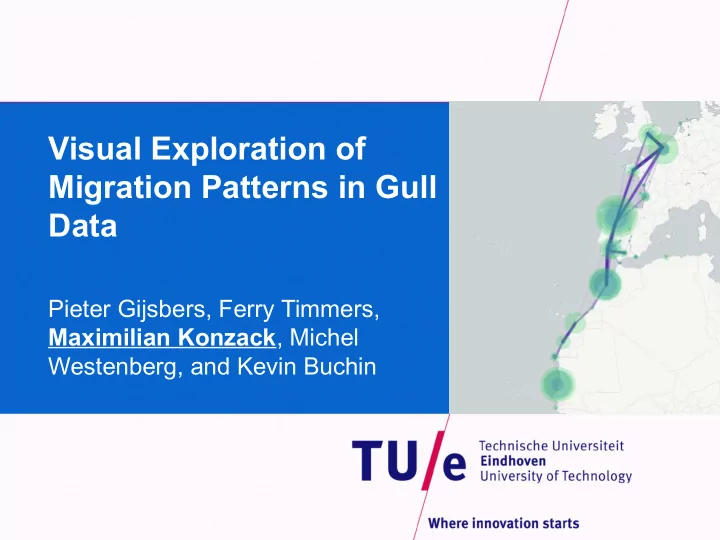

Visual Exploration of Migration Patterns in Gull Data Pieter Gijsbers, Ferry Timmers, Maximilian Konzack , Michel Westenberg, and Kevin Buchin
Data Set: 72 Lesser Black Backed Gulls • 85 MB after preprocessing – Time stamps correspond to different time zones – All mapped to one time zone • 29 herring gulls without migration flights • Location is accurate – Altitude somewhat unreliable – Use only longitude and latitude
Task 1: Identify Spatial Patterns • Understand and compare spatial patterns • Deviation of an individual from the group's migration strategy Trajectory Density Map a)Interpolation b)Count values in a grid c)Bin values to color scheme from yellow to red
Task 2: Identify Temporal Patterns • Temporal migration strategy of an individual gull • Ranging from day/night patterns over days to seasonal patterns 1.Day in light blue 2.Night in black 3.Twilight in purple
Task 3: Identify Stopovers • Idea of segmentation: identify different homogeneous movement episodes • Helps to summarize and visualize large trajectory data sets interactively • Criterion for stops on multiple trajectories
Task 3: Identify Stopovers Steps to compute the stopovers: 1.Classify idle points: speed of a point wrt. the previous point below a given threshold 2.Compute stops: smallest disk containing the corresponding idle points 3.Triangulation on stop centers 4.Aggregate stops on the scale of analysis
Task 4: Compare Groups and Individuals • Overview of gulls with similar migration strategy • Calendar view by selecting a stopover or an individual gull • Insight into temporal information on stops • Count of stops per day in a saturation of purple
Findings 1.Night activity of gulls 2.Inland migration: gulls stay over winter in Europe 3.Gulls stopping in England and migrating to Africa do not stay in Europe in the winter
Thank you for your attention
Recommend
More recommend