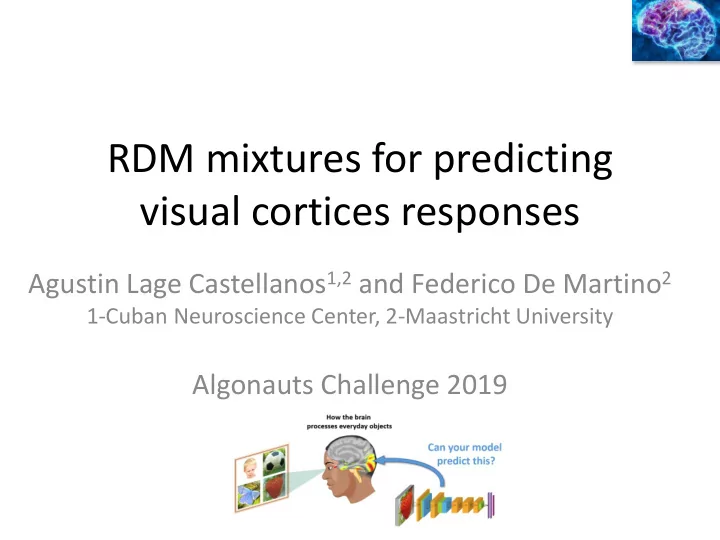

RDM mixtures for predicting visual cortices responses Agustin Lage Castellanos 1,2 and Federico De Martino 2 1-Cuban Neuroscience Center, 2-Maastricht University Algonauts Challenge 2019
Intuition behind our method fMRI-ITC Categorical MEG-Late DNN-L5 DNN-L4 MEG-early DNN-L3 fMRI-EVC DNN-L2 DNN-L1 Perceptual
Combining RDMs to improve predictions DNN Perceptual Predicted RDM Categorical = 𝑥 1 + 𝑥 2 + 𝑥 3
Perceptual RDMs
Perceptual RDMs Pixel Overlap Perceptual-RDM Extract Edges and Smooth Only uses image information
Categorical RDMs
Categorical Structure of the 92 image set Objects-Scenes animals Human Fruits-vegetables Faces Hands Monkey faces Animal Faces
Within category RDM based on fMRI/MEG data similarity fMRI-ITC mean 8 x 8 92 x 92 Between image fMRI/MEG similarity Between category fMRI/MEG similarity
Training a GNB classifier as predicting category Class Labels GNB Leave one out CV on the 92 image Last fully connected layer training set (defines category membership)
Classification of the 78 test set images Predicted Labels Objects-Scenes 𝑋 x animals 𝐻𝑂𝐶 Human Fruits-vegetables Faces Hands Animal Faces Predicted as Human Faces Predicted as Animal Faces in the 78 set
Assigning distances between new test images based on categorical RDM and predicted labels Test Set Image 1 human face Assigned distance 0.37 animal face Test Set Image 2
Predicted categorical RDM for the 78 images test data Same distance for all the images within the same category
Mixing perceptual and categorical components 𝑆 = 1 − 𝑥 2 𝑆 𝑞𝑓𝑠 + 𝑥 2 𝑆 𝑑𝑏𝑢 Training data: 92 image set Large impact on fMRI-ITC and MEG-Late.
Results Test set: Perceptual + Categorical RDMs
DNN based RDMs
RDM based on DNN features at one layer 117 𝑦 117 Vgg L-1 64 DNN 63 corr 2 1 mean 0.12 64 63 2 1
Model Improvement including DNN Based RDMs 𝑆 = 1 − 𝑥 3 𝑆 (𝑞𝑓𝑠+𝑑𝑏𝑢) + 𝑥 3 𝑆 𝑒𝑜𝑜 Improvement of 𝑆 2 (explained variance) in EVC for the 92 image set 𝑥 3 𝑥 3 𝑥 3
Results Test set including DNNs
Conclusions • A mixture of perceptual and categorical RDMs made the largest contribution to the prediction accuracy in fMRI-ITC/MEG-Late. • VGG was the DNN that produced the largest improvement on the model performance. • However, it is necessary to evaluate the perceptual-categorical vs DNN contribution in the inverse order.
Recommend
More recommend