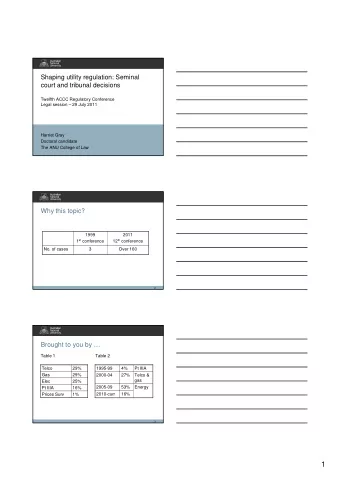
Unaudited financial results For the six months ended 31 December 2017 www.bidvest.com
Agenda 01 Introduction Lindsay Ralphs 02 Financial review Peter Meijer 03 Operational updates Lindsay Ralphs 04 Strategic overview and outlook Lindsay Ralphs 05 Appendices 2
We are Bidvest – strong track record of consistent delivery, returns and growth A leading South African B2B services, trading and distribution group operating in the areas of commercial and industrial products, electrical products, financial services, freight management, office and print solutions, outsourced hard and soft services and automotive retailing Blended portfolio of defensive, cyclical and growth assets, incorporating: – Services 61% of trading profit – Trading and distribution 39% of trading profit Cash generative businesses that are relatively capital light Highly entrepreneurial and decentralised management teams supported by lean corporate office Tend to be market leaders in operating spheres Strong track record of efficient capital allocation Embrace change through innovation Proven ability to quickly execute and assimilate acquisitions 29 years of consistent trading profit outperformance Highly regarded brands Positioned for international expansion in chosen niche areas 3
Our strategy and progress Maintain strong Maximise diverse Going beyond Stewardship financial position portfolio via innovation +12.3% SA trading profit Internationalisation : good given Tight asset management Acquired Noonan for EUR175mn Employ 130 000 people limited economic activity (effective Sep 2017) Weak areas were industrial project At seasonally weakest point, debt Bolt-on acquisitions : Governance is in our DNA, it is how activities and durable burden low at 7.6x interest cover; Acquired USS (GBP21mn) and we do business. Entrenched, consumer goods 1.1x net debt/EBITDA others across most divisions effective structures in place Invest in SA : Strong associate performance Strong improvement in operational Invested R240mn in multi-purpose 80% of businesses level 1-4 B-BBEE justifies patient cash generation tanks. R1bn LPG tank project accredited disposal approach on track 3 900 learnerships and R571mn Continued talks on non-core spend on skills development assets. Bidfish disposal underway in FY17 4
Diversified portfolio Contribution to revenue Contribution to trading profit 5% 5% 7% 10% 22% 5% 30% 13% 12% 7% 11% 11% 20% 11% 31% Services Freight Commercial Products Services Freight Commercial Products Automotive Office & Print Financial Services Automotive Office & Print Financial Services Electrical Namibia Electrical Namibia 5
Highlights for the six months HEPS increased by 12.5% to 574 cents HEPS 574 580 DPS declared of 255 cents, up 12.3% 560 Cents per share Flat GP margin 540 510 520 Trading profit up 12.0% to R3 143 million 500 Excellent results from Freight, Services and Office & Print; 480 Good results from Electrical and Commercial Products 460 H1 '17 H1 '18 Maiden contribution from Noonan DPS Non-core Bidfish disposal underway 260 255 Strong balance sheet 250 Cents per share Cash flow generation excellent in seasonally slower period 240 227 230 Net interest flat despite investments amounting to R4 914 million 220 210 H1 '17 H1 '18 6
Financial review Peter Meijer www.bidvest.com
Financial highlights R billion Interim ended Dec 31 2017 Interim ended Dec 31 2016 Change Revenue 39.9 36.0 10.7% Gross profit %* 28.1% 28.0% ↑ Expenses %* 20.6% 20.1% ↑ EBITDA 4.0 3.6 10.3% Trading profit 3.1 2.8 12.0% Trading margin %* 7.9% 7.8% ↑ Headline earnings 1.9 1.7 13.4% HEPS cents 574.0 510.3 12.5% DPS cents 255.0 227.0 12.3% Rolling EBITDA interest cover 7.6x 7.5x ↑ Net debt / rolling EBITDA 1.1x 1.1x - Weighted no of shares 335.5m 332.9m ↑ * As % of Revenue 8
Income statement R million Interim ended Dec 31 2017 Interim ended Dec 31 2016 Change Revenue 39 909 36 036 10.7% Gross income 11 218 10 080 11.3% Operating expenses (8 208) (7 252) 13.2% Trading profit 3 143 2 807 12.0% Other costs (61) (15) 319.6% Net capital items (2) 229 (100.8%) Net finance charges 524 521 0.4% Associate income 214 201 6.7% Taxation (736) (638) 15.3% Non-controlling interests 69 38 82.8% Headline earnings 1 926 1 699 13.4% HEPS (cps) 574.0 510.3 12.5% DPS (cps) 255.0 227.0 12.3% 9
Income statement analysis Revenue increased by 10.7% or R4 billion; 3.3% organic growth Services and Commercial Products revenue boosted by acquisitions; Bidvest Properties up 9.1%; Financial Services Revenue and Namibia revenue declined Freight revenue increased significantly (up 19.3%) on higher activity levels Flat gross margin Gross Margin pressure in motor and construction-related industries neutralised by revenue mix changes and acquisitions income Like-for-like expense growth of 8.5% mainly impacted by variable expenses in Freight to cope with higher activity levels Expenses Expense ratio increased from 20.1% to 20.6% Trading profit increased by 12.0%; 6.6% organic growth Excellent contributions from Freight, Office & Print and Bidvest Properties Trading profit Strong organic contribution from Services. Satisfactory performance from Commercial Products Acquisition costs of R49 million, mainly relating to Noonan Other costs Amortisation of acquired intangible assets of R12 million Negative movements on recoverable value of associates based on share price movements Sale of vessel in Namibia Net capital items Disposal and closure of businesses and assets 10
Income statement analysis (continued) Flat net finance charges testament to strong cash generation Net finance Increased debt to finance Noonan and USS acquisitions (EUR200 million) at favourable rate charges Cash inflow from non-core asset disposal Share of current period earnings increased by R46 million, +26.4% Associate income Increase mainly from Adcock Ingram earnings Effective tax rate 29.1% No tax shield on preference shares, MIAL m-t-m and acquisition costs Taxation Acquired foreign operations lowered tax rate by 0.2% Share of minorities, net of capital items, in line with earnings from Bidvest Namibia Non-controlling Capital profit on disposal of Bidfish vessel interest 12.5% growth despite tough trading conditions in SA and Namibia HEPS Organic growth 11.9% Interim dividend 255 cents vs 227 cents Dividend Cover ratio of 2.25 times consistent with policy 11
Debt and funding – a conservative approach to gearing Net debt of R9.0 billion (R8.4 billion H1 2017) Interest cover 10 Rolling EBITDA interest cover of 7.6x (7.5x H1 2017) 8 8.0 7.6 7.5 7.5 7.2 18% of long-term debt at fixed rates (47.7% H1 2017) 6 4 Bulk of new debt is offshore at attractive variable rates 2 7.8 5.1 8.4 5.6 9.0 61% of total debt long term (51% H1 2017) 0 H1 '16 FY16 H1 '17 FY17 H1 '18 Ample headroom to fund organic and/or acquisitive expansion Net debt (Rbn) EBITDA interest cover (x) Moody’s Investor Services credit rating Long term Short term Outlook Aa1.za P-1.za National scale Rating under review (unchanged) (unchanged) Baa3 P-3 Global scale Rating under review (unchanged) (unchanged) 12
Cash flow H1 2018 (R bn) Cash generated vs working capital (R bn) Cash generated from ops pre wc Net wc Cash conversion 3.9 5 100% 51% cash -0.6 conversion 4 80% 80% 75% 3 3.9 -1.5 60% 2.3 3.7 51% 3.5 2 1.5 3.4 40% 3.3 1 21% 20% 0 0% -3.4 -1 -0.6 -0.5 0.7 -20% -20% -2 -0.6 -1.9 -2.0 -3 -40% -1.0 H1 '16 H2 '16 H1 '17 H2 '17 H1 '18 Cash Working Capex Cash Net Taxation Distributions Cash generated capital effects of Finance effects of from ops (absorbed) investing charges financing pre WC /released act's act's Cash conversion seasonally weaker in H1. Strong improvement year-on-year. Non financial services conversion improved and Bidvest Bank raised new deposits Working capital absorbed of R0.6 billion (R1.9 billion H1 2017) Capex spend continues in SA – multi-purpose tanks, PPE, etc. 13
Operational update Lindsay Ralphs www.bidvest.com
Bidvest South Africa | Overview R million Interim ended Dec 31 2017 Interim ended Dec 31 2016 Change Revenue 38 670 34 845 11.0% Trading profit 3 159 2 812 12.3% Trading margin 8.2% 8.1% ↑ EBITDA 3 962 3 565 11.1% Average funds employed 18 286 17 318 8.5% Average ROFE 34.7% 33.1% ↑ Revenue Trading income 1HFY17 1HFY18 1HFY17 1HFY18 14000 1000 12000 800 10000 600 8000 6000 400 4000 200 2000 0 0 Services Freight Commercial Automotive Office & Financial Electrical Namibia Services Freight Commercial Automotive Office & Financial Electrical Namibia Products Print Services Products Print Services 15
Recommend
More recommend
Unleash a World of Digital Possibilities—Browse, Share, and Explore Content Without Boundaries