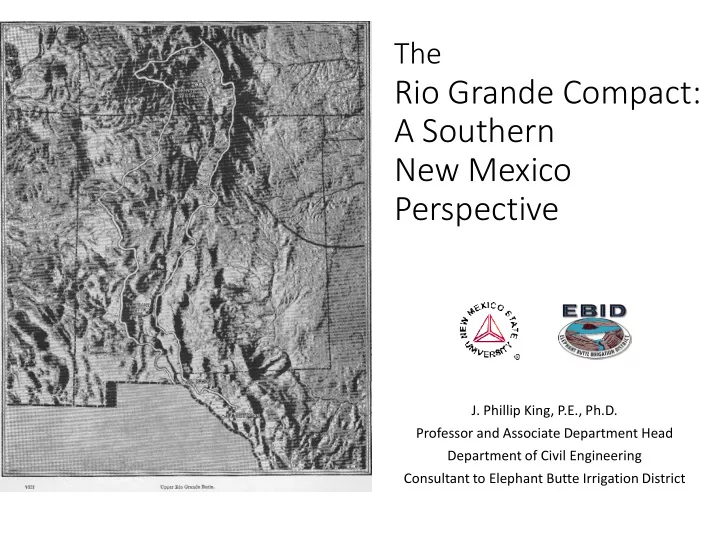

The Rio Grande Compact: A Southern New Mexico Perspective J. Phillip King, P.E., Ph.D. Professor and Associate Department Head Department of Civil Engineering Consultant to Elephant Butte Irrigation District
Evolution of Water Management in Southern New Mexico • Treaty with Mexico – 1906 • The Rio Grande Project – 1905-1916 • The Rio Grande Compact – 1938 • The Drought Years – 1951-1978 • The Wet Years – 1979-2002 • Back to Drought – 2003 - ?
New Mexico: 1905-1916 Elephant Butte Irrigation District The Rio Grande (EBID) 90,640 acres (57%) Project El Paso County Water Improvement District No. 1 (EPCWID) 69,010 acres (43%) Mexico 60,000 AF
Release and Storage in the Rio Grande Project, 1917-2013 1916-1950: 1951-1978: 1979-2002: 2002-2014: Plentiful Supply Drought I The Wet Years Drought II Annual Release Storage
1929-1938: The Rio Grande Compact • Compact for Surface Water Apportionment – Colorado – New Mexico – “Texas” • Colorado delivery to New Mexico • New Mexico Delivery to Texas Compact NM Compact TX • No man’s land: EBID
Colorado delivery to New Mexico
Upstate New Mexico delivery to “Texas” Exclusive of flows in July, August, September
Upstate New Mexico delivery to “Texas”
The 2013 Release Allocation Used +/- EBID 53,713 54,002 -289 EPCWID 43,223 51,561 -8,338 Mexico 3,665 3,709 -44 Totals 100,601 109,272 -8,671 Caballo release 168,607 Diversion ratio 64.8% D2 Diversion Ratio 80.4% Drought-adjusted D2 DR 62.7%
Data from Connie A. Woodhouse, 2012.
Looking Ahead – NOAA TR NESDIS 142-5
Fig. 1. Modeled changes in annual mean precipitation minus evaporation over the American Southwest (125°W to 95°W and 25°N to 40°N, land areas only), averaged over ensemble members for each of the 19 models. R Seager et al. Science 2007;316:1181-1184 Published by AAAS
The State’s Case EBID % EP1 % EBID Year EBID Alloc of US EP1 Alloc of US MX Alloc 57% EP1 43% EBID Δ 2006 211,385 47% 241,657 53% 27,112 257,211 195,831 45,826 2007 311,517 44% 403,491 56% 51,245 405,940 309,068 94,423 2008 324,990 39% 517,455 61% 56,048 478,291 364,154 153,301 2009 345,817 38% 552,987 62% 58,688 510,289 388,515 164,472 2010 305,871 36% 532,159 64% 56,883 475,785 362,245 169,914 2011 77,104 22% 267,814 78% 25,650 195,825 149,094 118,720 2012 126,427 48% 136,380 52% 23,188 149,207 113,600 22,780 Total 1,703,111 2,651,943 298,814 769,436 Total Allocation 4,653,868
The Problem: Math Total Allotment 4,653,868 AF Total Release 3,867,137 AF Difference 786,731 AF 112,390 AF per year Total Diversion Charges 3,669,625 AF Difference 984,243 AF 140,606 AF per year
Primary Culprit: Multiple Counting of Carryover EBID Carryover EP1 Carryover Total Carryover 2006 0 36,200 36,200 2007 0 106,982 106,982 2008 0 232,985 232,985 2009 40,343 232,985 273,328 2010 20,015 224,348 244,363 2011 17,333 9,042 26,375 2012 0 9,483 9,483 Total 77,691 852,025 929,716
Charge + Δ Carryover Year EBID Total EP1 Total Total EBID % EP1 % 57% 43% EBID Δ 2006 211,841 213,383 425,224 50% 50% 241,417 183,807 -29,576 2007 302,665 349,034 651,699 46% 54% 369,997 281,702 -67,332 2008 329,294 405,176 734,470 45% 55% 416,989 317,481 -87,695 2009 345,818 360,426 706,244 49% 51% 400,964 305,280 -55,146 2010 261,754 275,972 537,726 49% 51% 305,290 232,436 -43,536 2011 57,089 40,784 97,873 58% 42% 55,567 42,306 1,523 2012 117,053 110,005 227,058 52% 48% 128,910 98,148 -11,858 Total 1,625,514 1,754,780 3,380,294 48% 52% 1,919,135 1,461,159 -293,621 Average 232,216 250,683 482,899 274,162 208,737 -41,946
Recommend
More recommend