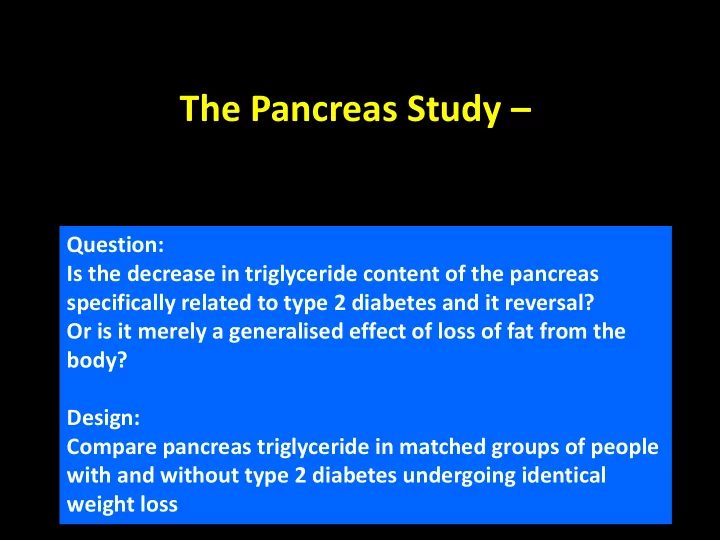

The Pancreas Study – Question: Is the decrease in triglyceride content of the pancreas specifically related to type 2 diabetes and it reversal? Or is it merely a generalised effect of loss of fat from the body? Design: Compare pancreas triglyceride in matched groups of people with and without type 2 diabetes undergoing identical weight loss
Baseline subject characteristics Type 2 DM NGT n=18 N=9 49.1 ± 1.6 46.3 ± 2.1 Age (yr) 121.0 ± 3.0 114 ± 5.0 Weight (kg) 42.7 ± 0.7 41.3 ± 1.0 BMI (kg/m 2 ) 6.9 ± 0.5 DM duration (yr) 7.6 ± 0.4 HbA1c (%) Insulin treated 3 SU treated 9 Steven et al, Diabetes Care 39(1):158-65; 2016
Fat mass in type 2 diabetic and normal glucose tolerance groups – before and after weight loss 60 Fat mass (kg) 50 40 30 T2DM NGT 13.6 0.7 % 12.8 0.8 % Decrease body weight
Fasting plasma glucose in T2DM and NGT – Before and after weight loss 15 p<0.001 Plasma glucose (mmol/l) 10 5 0 T2DM NGT Steven et al, Diabetes Care 39(1):158-65; 2016
Hepatic insulin resistance in T2DM and NGT – before and after weight loss p<0.001 -1 pmol.l -1) Hepatic insulin resistance p<0.002 4 3 (mmol.min -1 .kg ffm 2 1 0 T2DM NGT Steven et al, Diabetes Care 39(1):158-65; 2016
Liver fat in T2DM and NGT – before and after weight loss p<0.05 15 p<0.02 Liver fat (%) 10 5 0 T2DM NGT Steven et al, Diabetes Care 39(1):158-65; 2016
Insulin secretion before and after weight loss NGT T2DM 1.4 1.4 1.2 1.2 ISR (nmol/min/m 2 ) ISR (nmol/min/m 2 ) 1.0 1.0 0.8 0.8 0.6 Baseline 0.6 0.4 0.4 0.2 0.2 -20 0 20 40 60 80 -20 0 20 40 60 80 Time (min) Time (min) 1.4 1.4 1.2 1.2 ISR (nmol/min/m 2 ) ISR (nmol/min/m 2 ) 1.0 1.0 0.8 0.8 8 weeks 0.6 0.6 0.4 0.4 0.2 0.2 -20 0 20 40 60 80 -20 0 20 40 60 80 Time (min) Time (min)
First phase insulin secretion in T2DM and NGT – before and after weight loss p<0.02 First phase insulin response 0.5 p<0.005 0.4 (nmol min -1 m -2 ) 0.3 0.2 0.1 0.0 T2DM NGT Steven et al, Diabetes Care 39(1):158-65; 2016
Pancreatic triglyceride in T2DM and NGT – before weight loss and after weight loss p<0.01 8 Pancreatic triglyceride (%) p<0.005 triacylglycerol (%) 7 Pancreatic 6 5 4 T2DM NGT Steven et al, Diabetes Care 39(1):158-65; 2016
Pancreatic triglyceride in T2DM and NGT – before weight loss and after weight loss 8 Pancreatic triglyceride (%) p<0.005 triacylglycerol (%) 7 Pancreatic Decrease of 1.2% 6 Mean pancreas volume ~50ml This represents 5 ~0.6 grams of fat 4 T2DM NGT Steven et al, Diabetes Care 39(1):158-65; 2016
Conclusions Weight loss over 8 weeks brings about loss of pancreatic triglyceride specifically in type 2 diabetes It is likely that type 2 diabetes is caused by less than 1 gram of fat in the pancreas
Recommend
More recommend