The HPC Challenge Benchmarks and the PMaC project Certificates of - PDF document
The HPC Challenge Benchmarks and the PMaC project Certificates of relevance for benchmarks Certificates of relevance for benchmarks Do they cover a useful performance space? Do they cover a useful performance space? Do they
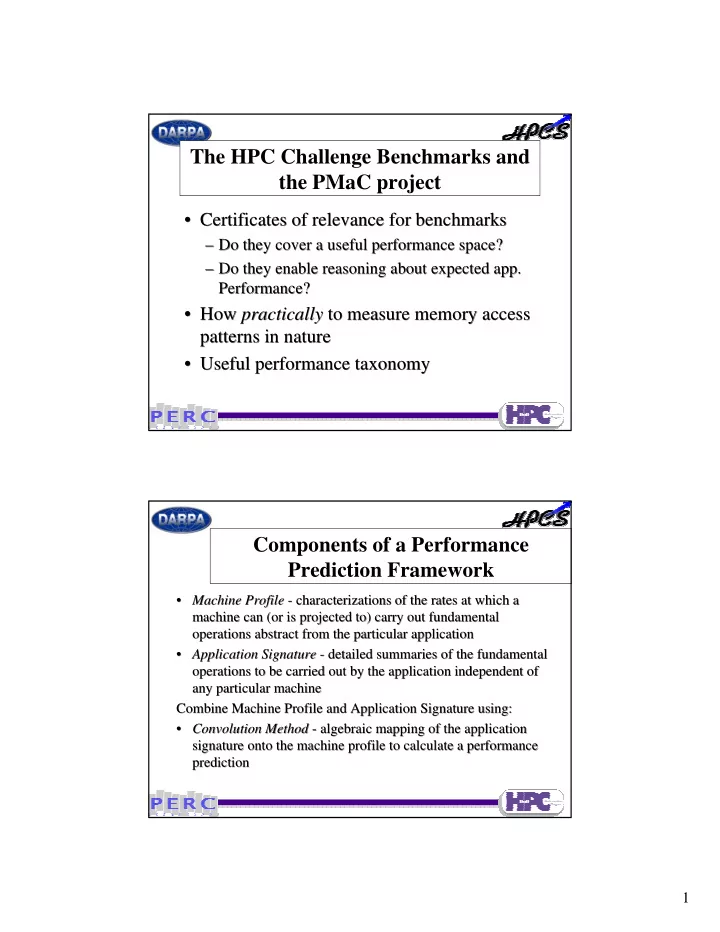
The HPC Challenge Benchmarks and the PMaC project • Certificates of relevance for benchmarks • Certificates of relevance for benchmarks – Do they cover a useful performance space? – Do they cover a useful performance space? – Do they enable reasoning about expected app. – Do they enable reasoning about expected app. Performance? Performance? • How practically to measure memory access • How practically to measure memory access patterns in nature patterns in nature • Useful performance taxonomy • Useful performance taxonomy Components of a Performance Prediction Framework • Machine Profile - characterizations of the rates at which a • Machine Profile - characterizations of the rates at which a machine can (or is projected to) carry out fundamental machine can (or is projected to) carry out fundamental operations abstract from the particular application operations abstract from the particular application • Application Signature - detailed summaries of the fundamental • Application Signature - detailed summaries of the fundamental operations to be carried out by the application independent of operations to be carried out by the application independent of any particular machine any particular machine Combine Machine Profile and Application Signature using: Combine Machine Profile and Application Signature using: • Convolution Method - algebraic mapping of the application • Convolution Method - algebraic mapping of the application signature onto the machine profile to calculate a performance signature onto the machine profile to calculate a performance prediction prediction 1
MAPS Data Stride-one access L1 cache Random access Stride-one access Stride-one access L1/L2 cache L1/L2 cache L2 cache/Main Memory MAPS – MAPS – Memory bandwidth benchmark Memory bandwidth benchmark measures memory rates (MB/s) measures memory rates (MB/s) for different levels of cache for different levels of cache (L1, L2, L3, Main Memory) (L1, L2, L3, Main Memory) and different access patterns and different access patterns (stride-one and random) (stride-one and random) Convolutions MetaSim trace collected on Cobalt 60 MetaSim trace collected on Cobalt MetaSim trace collected on Cobalt 60 60 Basic- simulating SC45 memory structure simulating SC45 memory structure simulating SC45 memory structure Block Procedure # Memory L1 hit L2 hit Random Memory Number Name References rate rate ratio Bandwidth 5247 Walldst 2.22E11 97.28 99.99 0.00 8851 10729 Poorgrd 4.90E08 88.97 92.29 0.20 1327 8649 Ucm6 1.81E10 92.01 97.07 0.23 572 n ∑ Memory time = MemOpsBBi/MemRateBB 1 i=1 2
Results-Predictions for AVUS (Cobalt60) AVUS TI AVUS TI- AVUS TI-05 standard data set on 64 CPUs -05 standard data set on 64 CPUs 05 standard data set on 64 CPUs System Actual time (s) Predicted time (s) % Error NAVO IBM PWR3 (Habu) 8,601 11,180 +30% ARL IBM PWR3 (Brainerd) 10,675 10,385 -3% MHPCC IBM PWR3 (Tempest) 8,354 9,488 +14% MHPCC IBM PWR4 4,932 4,258 -14% (Hurricane) NAVO IBM PWR4 (Marcellus) 4,375 4,445 +2% ARL IBM PWR4 (Shelton) 6,192 NAVO IBM PWR4+ (Romulus) 3,272 3,239 -1% ASC HP SC45 3,334 2,688 -19% ARL Linux Networx Xeon 3,459 Cluster Spatial and Temporal Locality How could one Quantify the Spatial and Temporal Locality in a Real Code? N Σ SpatialScore(N) = (Refs Stride i / i) / Total Refs i=1 TemporalScore(N) = Observed Reuse / (Total Refs – Spatial Refs) 3
It’s Harder Than it Looks Where does one plot RandomAccess? for ( i = 0; i < N; i++) { add = random_number; table[add] ^= random_number; } 1 Update (design goal) Load + Store (temporal) Temporal ? Load + Store (spatial) Two loads + Store 0 0 Spatial 1 HPC Challenge Benchmarks on axes of spatial and temporal locality 1 HPL 0.8 FFT 0.6 Tem poral NAS CG C AVUS 0.4 0.2 Random Access Streams 0 0.7 0.75 0.8 0.85 0.9 0.95 1 -0.2 Spatial 4
Recommend
More recommend
Explore More Topics
Stay informed with curated content and fresh updates.

![UL HPC School 2017[bis] PS1: Getting Started on the UL HPC platform UL High Performance](https://c.sambuz.com/872756/ul-hpc-school-2017-bis-s.webp)
