The Absorption Spectrum of I odine I I Symmetric Stretch Susumu - PowerPoint PPT Presentation
The Absorption Spectrum of I odine I I Symmetric Stretch Susumu Takahashi CHEM 332L-January 10, 2016 15-20 min. powerpoint/ White-board presentation Goal of the experiment Determination of the molecular electronic and vibrational
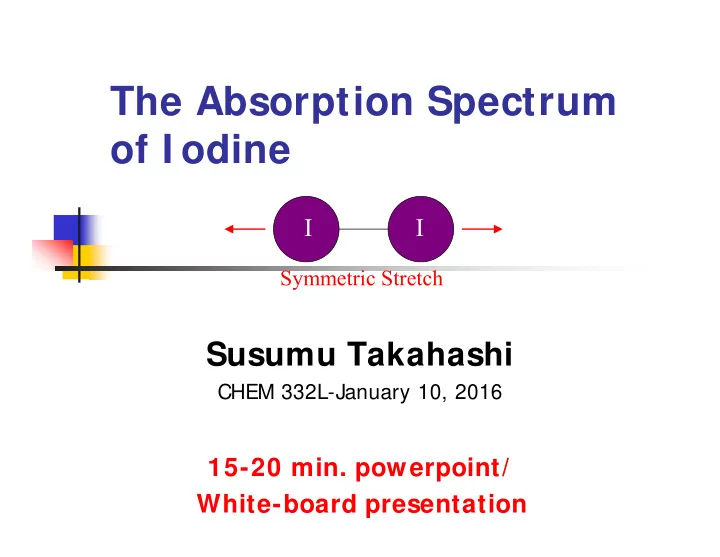
The Absorption Spectrum of I odine I I Symmetric Stretch Susumu Takahashi CHEM 332L-January 10, 2016 15-20 min. powerpoint/ White-board presentation
Goal of the experiment Determination of the molecular electronic and vibrational properties of I 2 . Dissociation energy of iodine in its ground and excited electronically states
Background -Energy diagram of I odine The vibrational levels are well described by (i = g or e) G(v) = ω i (v+1/2) - ω i x i (v+1/2) 2 Using vibrational spectroscopy, The followings are determined, 1. Energy levels ( and x ) 2. Dissociation energies (D)
Experimental setup - spectrometer PMT detector - Voltage (y) Grating angle readout (x) mirror slit Iodine sample Light source
Experimental details - Calibration of Spectrometer Mercury Penlight Calibration Data 1.40E-01 1.20E-01 Peak Average (Dial 1.00E-01 Number) Spectrum line (nm) Detected Signal 14000 254 8.00E-02 14816.5 297 14858.5 313 6.00E-02 15778 436 4.00E-02 15803.5 546 2.00E-02 0.00E+ 00 14000 14500 15000 15500 16000 Monochromator Dial Reading
Experimental details - Calibration of Spectrometer Mercury Penlight Calibration 600 500 y = 0.1442x - 1801.2 R² = 0.8307 Wavelength (Nanometers) 400 300 200 100 0 13500 14000 14500 15000 15500 16000 Monochromator Dial Reading
Experimental data (or expected result) A b s o rb a n c e S p e c tru m o f I 2 7 .0 6 .5 6 .0 5 .5 Absorbance (arbitrary units) 5 .0 4 .5 4 .0 3 .5 3 .0 2 .5 2 .0 1 .5 6 2 0 6 1 0 6 0 0 5 9 0 5 8 0 5 7 0 5 6 0 5 5 0 5 4 0 5 3 0 5 2 0 5 1 0 5 0 0 W a v e le n th (n m )
Experimental data (or expected result) 7.0 N um bering of B ands in the S elected S pectrum (575-520 nm ) of I 2 6.5 6.0 5.5 Absorbance (arbitrary units) 5.0 4.5 4.0 3.5 3.0 15 17 18 19 20 21 23 24 25 26 27 31 32 34 35 36 37 38 16 22 28 29 30 33 v"= 0 2.5 2.0 19 21 22 17 18 20 24 25 26 27 28 29 30 23 v"= 1 1.5 23 20 21 22 1.0 v"= 2 0.5 575 570 565 560 555 550 545 540 535 530 525 520 W avelenth (nm ) Explain data points carefully
Data analysis - plot of the result 115 Birge-Sponer Plot for v"=0 110 105 100 95 90 -1 ) 85 G (cm Y= 140.176 (2.981) - 2.204(.1055)X 80 75 70 65 -1 Integrated Area = 4456.501 cm 60 55 50 16 18 20 22 24 26 28 30 32 34 36 38 40 v'+1
Summary Summarize the goal of the experiment State expected finding Discuss prelimnary result and error analysis if there is
Recommend


More recommend
Explore More Topics
Stay informed with curated content and fresh updates.