Supplementary Information: Definitions and reconciliation of - PDF document
Supplementary information BP 4Q05 results and strategy presentation Supplementary Information: Definitions and reconciliation of non-GAAP measures. The information below has been provided to enhance understanding of the terminology and
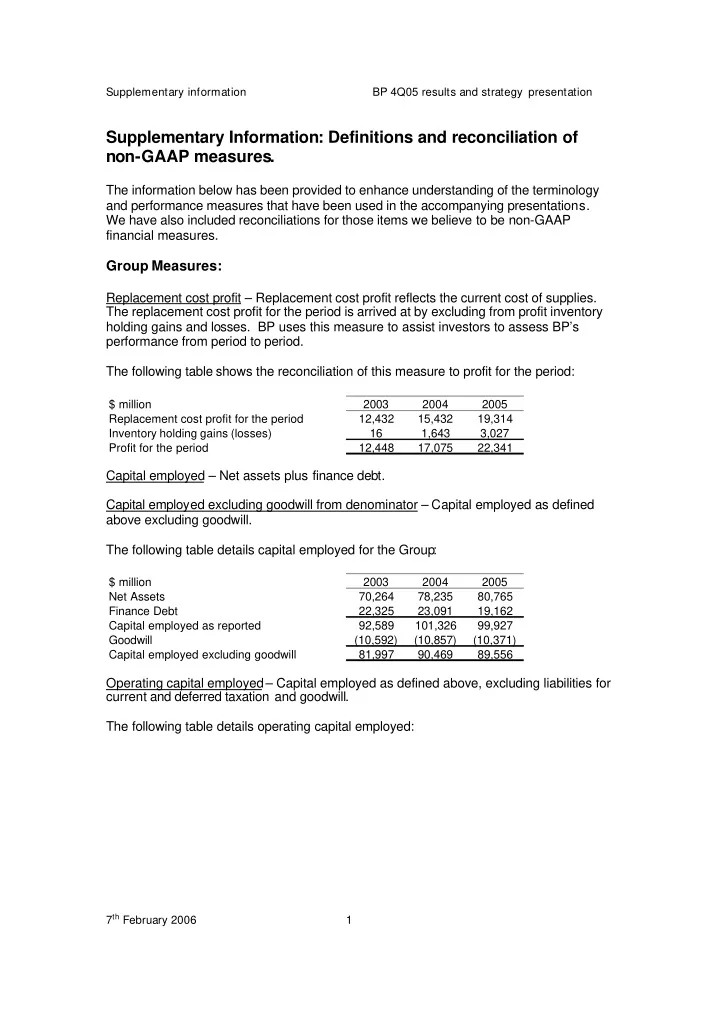
Supplementary information BP 4Q05 results and strategy presentation Supplementary Information: Definitions and reconciliation of non-GAAP measures. The information below has been provided to enhance understanding of the terminology and performance measures that have been used in the accompanying presentations. We have also included reconciliations for those items we believe to be non-GAAP financial measures. Group Measures: Replacement cost profit – Replacement cost profit reflects the current cost of supplies. The replacement cost profit for the period is arrived at by excluding from profit inventory holding gains and losses. BP uses this measure to assist investors to assess BP’s performance from period to period. The following table shows the reconciliation of this measure to profit for the period: $ million 2003 2004 2005 Replacement cost profit for the period 12,432 15,432 19,314 Inventory holding gains (losses) 16 1,643 3,027 Profit for the period 12,448 17,075 22,341 Capital employed – Net assets plus finance debt. Capital employed excluding goodwill from denominator – Capital employed as defined above excluding goodwill. The following table details capital employed for the Group: $ million 2003 2004 2005 Net Assets 70,264 78,235 80,765 Finance Debt 22,325 23,091 19,162 Capital employed as reported 92,589 101,326 99,927 Goodwill (10,592) (10,857) (10,371) Capital employed excluding goodwill 81,997 90,469 89,556 Operating capital employed– Capital employed as defined above, excluding liabilities for current and deferred taxation and goodwill. The following table details operating capital employed: 7 th February 2006 1
Supplementary information BP 4Q05 results and strategy presentation $ million 2003 2004 2005 Exploration and Production 59,352 65,223 68,721 Refining and Marketing 34,251 38,262 39,669 Gas, Power and Renewables 4,225 4,829 5,051 Other businesses and corporate 3,930 3,379 (2,602) Consolidation adjustment (361) (552) (778) Operating capital employed 101,397 111,141 110,061 Liabilities for current and deferred taxation (19,400) (20,672) (20,505) Goodwill 10,592 10,857 10,371 Capital employed 92,589 101,326 99,927 Return on average capital employed – reported (headline) basis Numerator – Replacement cost profit for the period plus minority interest plus interest post tax. Denominator – Average capital employed. Capital employed is defined above. Underlying return on average capital excluding goodwill Numerator – Replacement cost profit for the period plus minority interest plus interest post tax plus non-operating items Denominator – Average capital employed excluding goodwill from the denominator 7 th February 2006 2
Supplementary information BP 4Q05 results and strategy presentation The table below reconciles return on average capital employed based on profit for the period and using reported capital employed to return on average capital employed based on replacement cost profit, adjusted for non-operating items and using capital employed excluding goodwill from the denominator. A guide to the calculation of comparative metrics for competitors is provided separately on bp.com. UK GAAP (a) $ million 2000 2001 2002 2003 2004 Numerator Profit the period attributable to BP shareholders 6,556 6,795 12,448 17,075 Interest (b) 798 602 333 286 Minority interest 61 77 170 187 Adjusted profit for the period 7,415 7,474 12,951 17,548 Inventory holding (gains) losses 1,900 (1,129) (16) (1,643) Adjusted replacement cost profit 9,315 6,345 12,935 15,905 Non-operating items (post-tax) 299 642 234 1,072 Numerator excluding non-operating items 9,614 6,987 13,169 16,977 Denominator Capital employed as reported 87,200 87,158 86,480 92,589 101,326 Goodwill (12,198) (10,868) (10,438) (10,592) (10,857) Capital employed excluding goodwill 75,002 76,290 76,042 81,997 90,469 Average capital employed as reported (c) 87,179 86,819 87,732 96,958 Average capital employed excluding goodwill 75,646 76,166 77,216 86,233 Return on average capital employed -Adjusted profit for the period/ACE as reported 9% 9% 15% 18% - Adjusted RC profit/ACE as reported 11% 7% 15% 16% - Adjusted RC profit excluding NOIs/ACE excluding goodwill 13% 9% 17% 20% Calculation of 2005 ROACE (d) 1 Jan 2005 1Q 2Q 3Q 4Q 2005 Numerator Profit the period attributable to BP shareholders 6,602 5,591 6,463 3,685 Interest (b) 112 83 94 112 Minority interest 61 69 68 93 Adjusted profit for the period 6,775 5,743 6,625 3,890 Inventory holding (gains) losses (1,111) (610) (2,053) 747 Adjusted replacement cost profit 5,664 5,133 4,572 4,637 Non-operating items (post-tax) (542) 822 921 553 Numerator excluding non-operating items 5,122 5,955 5,493 5,190 Denominator Capital employed as reported (e) 101,230 99,475 99,399 104,885 99,927 Goodwill (10,857) (10,754) (10,555) (10,440) (10,371) Capital employed excluding goodwill 90,373 88,721 88,844 94,445 89,556 Average capital employed as reported 100,353 99,437 102,142 102,406 Average capital employed excluding goodwill 89,547 88,783 91,645 92,001 Return on average capital employed -Adjusted profit for the period/ACE as reported 27% 23% 26% 15% 23% - Adjusted RC profit/ACE as reported 23% 21% 18% 18% 20% - Adjusted RC profit excluding NOIs/ACE excluding goodwill 23% 27% 24% 23% 24% (a) Financial Information for 2001 and 2002 has not been restated for IFRS. The UK GAAP information for 2002 reflects the adoption of Financial Reporting Standard No.17 'Retirement Benefits' (FRS 17) with effect from 1 January 2004. Financial information for 2001 has not been restated. (b) Excludes interest on jointly controlled entities' and associates' debt and is on a post-tax basis using a deemed rate equal to the US statutory tax rate. (c) Opening capital employed at 1 January 2003 was $82,875 subsequent to the adoption of IFRS. (d) As a result of the Innovene disposal occuring on 16 December 2005, ROACE for 2005 has been calculated as the average of the four discrete quarterly returns during 2005. (e) Opening capital employed at 1 January 2005 was $101,230 subsequent to the adoption of IAS 39 on 1 January 2005 7 th February 2006 3
Supplementary information BP 4Q05 results and strategy presentation Organic capital expenditure (Organic Capex) – Capital expenditure excluding acquisitions and asset exchanges. See table under ‘Reinvestment ratio’ below. Inorganic capital expenditure– expenditure on acquisitions. Reinvestment ratio – Organic capital expenditure divided by net cash provided by operating activities. The following table details the calculation of the reinvestment ratio: UK GAAP (a) $ million 2001 2002 2003 2004 2005 Capital expenditure and acquisitions 14,091 19,093 19,623 16,651 14,149 Less acquisitions and asset exchanges (924) (5,790) (6,026) (2,841) (211) Organic capital expenditure (b) 13,167 13,303 13,597 13,810 13,938 Cash Flow from operations 17,487 15,943 16,303 23,378 26,721 Reinvestment Ratio 75% 83% 83% 59% 52% (a) Financial Information for 2001 and 2002 has not been restated for IFRS. The UK GAAP information for 2002 reflects the adoption of Financial Reporting Standard No.17 'Retirement Benefits' (FRS 17) with effect from 1 January 2004. Financial information for 2001 has not been restated. (b) Reported capital expenditure is that incurred by BP group entities and does not include capital expenditure incurred by equity-accounted entities. Net debt ratio – Ratio of net debt (finance debt less cash and cash equivalents) to net debt plus equity. The table below presents BP’s Debt to Debt plus Equity ratio on a gross basis as net debt is not a recognised GAAP measure: $ million 2004 2005 1Q 2Q 3Q 4Q 1Q 2Q 3Q 4Q Finance debt 19,937 19,858 20,445 23,091 19,564 19,302 22,159 19,162 Equity 72,493 73,088 75,114 78,235 79,911 80,097 82,726 80,765 Debt ratio 22% 21% 21% 23% 20% 19% 21% 19% Associated Companies – This term includes associates and jointly controlled entities, both of which are accounted for using the equity method of accounting. Growth rates – These are calculated as cumulative average growth rates over a period. They are not therefore growth rates that might be observed year after year. Free cash flow – Net cash provided by operating activities less net cash used in investing activities. 7 th February 2006 4
Recommend


More recommend
Explore More Topics
Stay informed with curated content and fresh updates.