Stochastic Modeling of Infectious Diseases The 34 th Quality and - PowerPoint PPT Presentation
Stochastic Modeling of Infectious Diseases The 34 th Quality and Productivity Research Conference - 2017 Volodymyr Serhiyenko vserhiyenko@metabiota.com June 15 th 2017 Agenda Hi Historical cal Examp xample Metabiota Overview
Stochastic Modeling of Infectious Diseases The 34 th Quality and Productivity Research Conference - 2017 Volodymyr Serhiyenko vserhiyenko@metabiota.com June 15 th 2017
Agenda Hi Historical cal Examp xample • Metabiota Overview • Disease Spread Modeling • Preparedness Index and • Coronavirus Risk Model
Outbreak Starts… • On February 21 st (2003), 64-year-old doctor who was treating “atypical pneumonia” in Guangdong province (China) arrived in Hong Kong to attend a wedding and stayed in Hot Hotel l Me Metr tropole • Ne Next da day he felt ill and was admitted to the intensive care unit • On March 4 he died from a mysterious respiratory disease of unk unkno nown n ori rigin n
Outbreak Spreads… • 20 20 cases ses were associated with the transmission on 9 th floor started from the index patient who spent only on one night in the hotel • 7 out of 20 cases were responsible for consequent large outbreaks in Canada , Vi Ca Vietnam , Si Sing ngapore , 9th floor layout of the Ho Hotel l Metropole le in Hong Kong Source: Christopher R. Braden, Scott F. Dowell, Daniel B. Jernigan, and Ho Hong Kong itself and James M. Hughes - Emerging Infectious Diseases Journal, Volume 19, Number 6—June 2013 • In Vietnam, Dr Dr. Ca Carlo Urbani , a WHO physician, recognized a new and highly contagious disease. He later became infected and died, but his ea early warni ning ng started a massive response worldwide
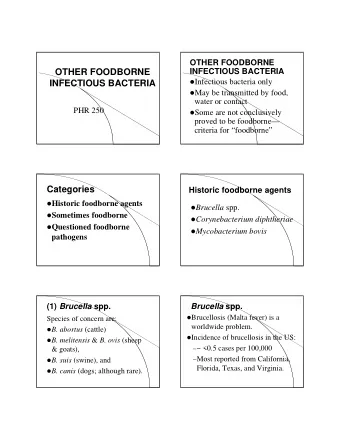
Outbreak Aftermath… • Mysterious disease was eventually named as Sev Sever ere e ac acute respirat atory syndrome me (SARS) • SARS outbreak started in Guangdong, China, on 16 16 2002 and ended in Taiwan on 5 No November 2002 5 Jul uly 2003 2003 (spreading to 27 es ) 27 count untries Co Count untry Cases Ca es Fa Fatal • Numerous Sup Super er-Sp Sprea eading ng Eve vents ts , like one in China 5327 349 Metropolitan Hotel, had been recorded Hong Kong 1755 299 Taiwan 346 73 CoV spread to humans from wild pa SA SARS-Co palm civet • Canada 251 43 Singapore 238 33 ts that are valued for their meat and are sold in ca cats Vietnam 63 5 Chinese markets. USA 27 0 Philippines 14 2 bats are the na • It is also believed that ba natur ural Other 75 6 reservoirs of SARS-like coronaviruses. re TO TOTAL 8096 810
Lessons learned for modeling… exible to consider different di • We must be fl flex disease s spe pecific cs like Super-Spreading Events, availability of ch charact cteristics vaccines, vaccination strategies (mass or ring), etc. vity and tra el patterns play • Gl Globa bal co connect ctivi travel a crucial role in the spread and magnitude of the disease epidemic • We must be prepared for new newly emer em erging ng infectious diseases
Agenda Historical Example • Me Metabiot ota Ov Overvie iew • Disease Spread Modeling • Preparedness Index and • Coronavirus Risk Model
Metabiota Mission $54B SARS $23B In the last decade, there (Global, 2003) have been over 470 470 MERS $11B human disease (Korea, 2015) outbreaks Foot & Mouth (UK, 2001) $3.3B Avian Flu $2B (US Midwest, 2015) Ebola (W. Africa, 2015) $900M Dengue Fever (Brazil, 2013)
Where is Metabiota? • Founded in 2008 with offices in San Francisco, Canada, Ukraine, Democratic Republic of Congo, and Cameroon and operations in 20 countries
Metabiota Team • Multidisciplinary team • Collaboration with academic partners • Perform epidemiological, statistical, and actuarial modeling
Agenda Historical Example • Metabiota Overview • Di Disease Spr pread d Mode deling • Preparedness Index and • Coronavirus Risk Model
Milestones in Epidemic Modeling
Modeling Cooperation • Me Metabiot ota closely cooperates with Al Alessand essandro Ve Vespignani and his colleagues from Northeastern University's Laboratory for the Mod Modeling of of Bi Biological and Socio-tec techni hnical Sy System stems • Together we are developing disease spread models to realistically simulate disease spark, spread, and duration of epidemics • Our main framework is Gl Global al E Epidemic an and Mo Mobility ty mode model l (GLE LEaM) that stochastically simulates the spread of epidemics at the worldwide scale
GLEaM framework S E I R Exposed Infected Removed Susceptible Underlying Compartmental Model • Global population is divided into basins around transportation hubs (i.e. airports). The resulting network consists of 3, 3,362 362 geographic subpopulations airline transportation data + Full ai nge mobility network + Sho Short rt-ra rang
Individual based model • Model probabilistically progresses ls through each compartment by in indiv ivid iduals ng values from stocha stoc hasti stically si simul ulati ting binomial and multinomial distributions 𝑁𝑣𝑚𝑢𝑗𝑜𝑝𝑛𝑗𝑏𝑚 𝐹 + 𝑢 , 𝑞 . / →1 / 2 , 𝑞 . / →1 / 3 , 𝑞 . / →1 / 43 𝐶𝑗𝑜𝑝𝑛𝑗𝑏𝑚 𝑇 + 𝑢 , 𝑞 7 / →. / • More details can be found in: Balcan, D., Gonçalves, B., Hu, H., Ramasco, J. J., Colizza, V., & Vespignani, A. (2010). Modeling the spatial spread of infectious diseases: The GLobal Epidemic and Mobility computational model. Journal of computational science , 1(3), 132-145.
Agenda Historical Example • Metabiota Overview • Disease Spread Modeling • Pr Preparedness Index and • Co Coronavirus Risk Model
Coronavirus Outbreaks 2003 outbreak: 8096 8096 cases, 810 810 deaths, 27 27 countries effected • SA SARS 2003 iratory Syndrome (MERS) 2013 outbreak: 1980 1980 cases, 699 699 deaths, 15 15 • Mid Middle le East Respir countries effected (as of June 6, 2017) – cased by novel MERS-CoV • First case reported in Saudi Arabia April 2012, still on on-go going • Saudi Arabia is the most affected country (80% of total cases) • Notable event: South Korea 2015 MERS outbreak Caused by on one index patient Source: de Wit et al., SARS and 182 182 cases with 37 37 deaths MERS: recent insights into emerging coronaviruses, 2016
Model Design – Compartments • Main model parameters: R 0 - basic reproductive number (number of secondary infections) 𝜗 9: - incubation period 𝜈 9: - infectious period Travel Reduction (%) Transmissibility reduction time, etc. • Super-Spreading Events: 𝑂𝑣𝑛𝑐𝑓𝑠 ~ 𝑂𝑓𝐶𝑗𝑜𝑝𝑛𝑗𝑏𝑚(𝑆 J , 𝑙) 𝑝𝑔 𝑡𝑓𝑑𝑝𝑜𝑒𝑏𝑠𝑧 𝑑𝑏𝑡𝑓𝑡
Differences among countries If outbreak starts in US USA , is it Hospital beds per capita going to be different from Ch Chin ina or Sierra Le Leone outbreak of the same disease? Country-level differences in • Outbreak surveillance • Outbreak reporting time Source: World Bank • Timing of intervention measures • … How do we capture these differences?
Epidemic Preparedness Index (1 (1=most p prepar ared, 4 , 4=leas ast p prepar ared) PHI: Public Health Infrastructure PI: Physical and Communications Infrastructure IC: Institutional Capacity EF: Economic Factors PHC: Public Health Communications
EPI influence on CFR On average, improving country’s Epidemic Preparedness by one unit is decreasing odds of dying by 28%
Be the Trusted Disease Model Li Library Pr Proprietary Da Data Set Source for 1M year stochastic event catalog • • 1,200+ Outbreaks Best in Class 18M stochastic realizations with • • 150+ Pathogens Models weekly resolution informed the • 240+ Data Sources event catalog • 230+ Countries / Territories 180K simulations evaluated • • Over 48M Cases 117K distinct demographic • subpopulations • Over 6M Deaths 88K+ AWS Compute optimized • • Curated, cleansed, hours to date continuously updated 100+TB of data • Largest in the industry •
Thank you! Questions?
Model Design – Spark Map Data Layers Bioclimatic Data Number of shared human-bat viruses Zoonotic mammal species Proximity to large cities Human Density Bat (Taphozous sp.) Dromedary Camel abundance PREDICT (Metabiota) data
Recommend


More recommend
Explore More Topics
Stay informed with curated content and fresh updates.