Simplifying Progress Sartorius Stedim Biotech Investors - PowerPoint PPT Presentation
Simplifying Progress Sartorius Stedim Biotech Investors Presentation H1 2020 Results Disclaimer This presentation contains statements concerning the future performance of the Sartorius Stedim Biotech Group. These statements are based on
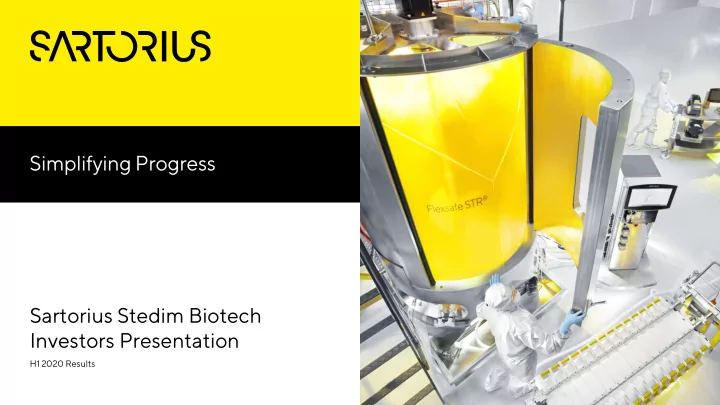
Simplifying Progress Sartorius Stedim Biotech Investors Presentation H1 2020 Results
Disclaimer This presentation contains statements concerning the future performance of the Sartorius Stedim Biotech Group. These statements are based on assumptions and estimates. Although we are convinced that these forward- looking statements are realistic, we cannot guarantee that they will actually materialize. This is because our assumptions harbor risks and uncertainties that could lead to actual results diverging substantially from the expected ones. It is not planned to update our forward-looking statements. Throughout this presentation, differences may be apparent as a result of rounding during addition. 2
Sartor toriu ius s Stedim dim Biote tech Agenda Overview ew | Strateg tegy Mid-term Growth Prospects FY 2020 Guidance | H1 2020 Results Appendix 3
Sartor toriu ius s Stedim dim Biote tech A leading partner of the biopharma industry We empower scientists and engineers to simplify and accelerate progress in life science and bioprocessing, enabling the development of new and better therapies and more affordable medicine. 4 Overview | Strategy
Sartor toriu ius s Stedim dim Biote tech Sartorius Stedim Biotech at a glance ~ € 1.4bn .4bn Four r strong ng pillars ars drive e above-avera verage ge growth th Sales revenue Pharma ma CAGR 4-7% ~15% market ket Sales CAGR 1 2014-2019 Biopha harm rma CAGR ~8% 29.3% market ket EBITDA margin 2 Double-digit >20 20 Singl gle-use use growth countries, penetr etrati tion on headquartered in Aubagne, France Esp. in North Market et 6,203 203 share gains America Employees Based on FY 2019 figures 1 In constant currencies 2 Excluding extraordinary items 5 Overview | Strategy
Sartor toriu ius s Stedim dim Biote tech Covering most steps of the biopharma process chain Production process design is inalterable for the lifetime of most drugs Individually customized production process Culture media Seed Scale-up Fermentation required for all drugs preparation cultivation Decisions for process UPSTR TREAM EAM design, and thus supplier selection, are typically DOWNSTR STREAM EAM made during clinical trials Final Cryo- Sterile Concen- Virus Chromato- Viral Clarification & filling preservation filtration tration filtration graphy clearance centrifugation 6 Overview | Strategy
Sartor toriu ius s Stedim dim Biote tech Strong market fundamentals 9bn people by 2050; Favorable demographics >2bn 60 yrs or older ~8% CAGR ~30% CAGR for biosimilar Rise of for biopharma biosimilars sales 2019 – 2022 market 2019 – 2025 Strong R&D pipeline; >40% share of biologics in advances in gene and pharma R&D pipeline cell therapy 7 Overview | Strategy
Sartor toriu ius s Stedim dim Biote tech Sales revenue more than doubled over the last 6 years ~ +14% Sales CAGR +18.8% EBITDA-margin 1 +8.4pp +13.7% € 1.4bn 1600 33.0 +4.1% 32.0 +20.4% 1400 31.0 +19.4% 30.0 1200 +15.9% 29.0 29.3 28.0 +10.8% 1000 28.2 27.0 27.5 +10.3% 27.3 800 26.0 26.2 25.0 € 477m 600 24.0 23.0 23.5 400 23.0 22.0 21.0 21.5 200 20.9 20.0 0 19.0 2011 2012 2013 2014 2015 2016 2017 2018 2019 EBITDA 1 margin in % Sales revenue Sales growth and CAGR in constant currencies 1 Excluding extraordinary items 8 Overview | Strategy
Sartor toriu ius s Stedim dim Biote tech M&A strategy – adding innovation, enhancing focus 2013 2014 2015 2016 2017 2018 2019 2020 TAP AllPure Bio Cellca kSep Umetrics Biological Life Science assets Biosystems Technologies Outsource Industries from Danaher Portfolio: Complementary products or technologies Market position: Either among the Top 3 or unique selling point Acquisiti sition on criter eria Integration: Management capacity; cultural fit Price: Fair valuation; reach Sartorius‘ profitability level in 2 -3 years 9 Overview | Strategy
Sartor toriu ius s Stedim dim Biote tech Acquisition of Biological Industries in Q4 2019 Developer and manufacturer of cell culture media Specializes in media for advanced therapies (cell and gene therapies) ~130 employees; headquartered in Beit Haemek, near Haifa (Israel) 2019 revenue € 20m to € 25m with healthy growth profile; slightly dilutive EBITDA margin Fully consolidated in Sartorius Stedim Biotech Closing of transaction in Dec. 2019, total purchase price of approx. € 45m for just over 50% of the shares 10 Overview | Strategy
Sartor toriu ius s Stedim dim Biote tech Acquisition of selected life science assets from Danaher Portfolio of upstream and downstream technologies with a strong complementary fit, especially in chromatography/purification Combined 2019 sales amounted to c. $100m with strong double-digit but slightly dilutive EBITDA margin ~100 employees with production sites in the U.S., EMEA and China Transaction part of a broader deal of Sartorius AG; of the total purchase price of $825m, approx. one third to be allocated to SSB Announced in Q4 2019, deal closed after all regulatory approvals were received; consolidation in May 2020 11 Overview | Strategy
Sartor toriu ius s Stedim dim Biote tech Leading positions in key technology platforms Sartorius 1 Merck | Danaher Thermo Top 3 Players Millipore Pall Cytiva 2 Fisher 1. Merck | Millipore Filtration 2. Danaher | Pall 3. Sartorius 1. Sartorius Fluid 2. Thermo Fisher Management 3. Merck | Millipore 1. Sartorius Fermentation 2. Thermo Fisher 3. Danaher | Cytiva 1. Danaher | Cytiva Purification 2. Merck | Millipore 3. Sartorius 1. Thermo Fisher Cell Culture 2. Merck | Millipore Media 3. Danaher | Cytiva Pie charts indicate completeness of product offering 1 Sartorius with strengthened portfolio after acquisition of selected life science assets from Danaher; 2 Formerly GE Biopharma 12 Overview | Strategy
Sartor toriu ius s Stedim dim Biote tech Leader in the growing single-use technology market Singl gle-use use market ket penetr etrati tion on expected ted to increa ease se from om ~35% to ~75% Single-use products offer advantages over conventional stainless-steel devices Capex|Opex reduction over entire lifecycle Reduced risk of cross-contamination Higher flexibility; advantageous for biosimilars -25-35% Reference -30-50% Single-use -55-65% -65-75% Construction cost Water cost Time-to-market Energy cost 13 Overview | Strategy
Sartor toriu ius s Stedim dim Biote tech Limited dependence on individual accounts Long-term business relationships with leading global Limited dependence on individual accounts (bio-) pharma companies Sales s to to Top 50 customer omers in 2019, € in millions 350 ~55% 300 ~50% ~45% 250 ~35% 200 Cumulative ~25% 150 share 100 50 0 Top 10 11 to 20 21 to 30 31 to 40 41 to 50 More than half of 2019 SSB sales were generated with the Top 50 customers No individual customer accounts for more than 5% of SSB sales revenue No single drug accounts for more than 3% of SSB sales revenue 14 Overview | Strategy
Sartor toriu ius s Stedim dim Biote tech Agenda Overview | Strategy Mid-term erm Growth th Prospects cts FY 2020 Guidance | H1 2020 Results Appendix 15
Sartor toriu ius s Stedim dim Biote tech Sartorius 2025 targets and initiatives Strategic initiatives 2025 targets Regiona onal Participate in strong Chinese market growth ~ € 2.8bn 2.8bn Continue to outperform the important U.S. market Sales revenue Portf tfoli olio Add high-impact innovation, e.g. digital tools Enhance process development capabilities Expand into adjacent applications ~30% 30% Opera rati tion ons EBITDA margin Accelerate workflows across the organization through digitalization Extend manufacturing base in Asia 2025 targets are based on 2017 currency exchange rates; non-organic revenue growth is accounted for companies acquired from 2018 and onwards; EBITDA excluding extraordinary items 16 Mid-term Growth Prospects
Sartor toriu ius s Stedim dim Biote tech U.S. remains most important market; China with highest growth rates Biologics gics ma market ket growth wth foreca cast st CAGR 2019 to 2023, € in billions U.S. U.S. ~155 ~110 ~+9% U.S. Europe Europe ~48 ~61 ~+6% Europe China China ~ € 335bn ~ € 240bn ~62 ~35 ~+15% China ROW ROW ~47 ~57 Biologics market in China is at an early stage, but has strong growth potential Supportive regulatory environment and solid industry foundation; biopharma considered a priority sector Growth of fermentation capacity in China of 80% (2018 to 2022) 17 Mid-term Growth Prospects
Sartor toriu ius s Stedim dim Biote tech Regional balance better reflecting end-markets ~ € 477m 477m ~ € 1.4 1.4bn bn ~ € 240 240bn bn CAGR 20 ~+16% 25% 27% % 27% ~+18% Asia | Pacific 35% 51% Americas 53% EMEA ~+11% 40% 22% 2011 2019 2019 Sales by region Sales by region Global biopharma market 2011 2019 2019 CAGR for continued operations, in constant currencies 18 Mid-term Growth Prospects
Recommend


More recommend
Explore More Topics
Stay informed with curated content and fresh updates.