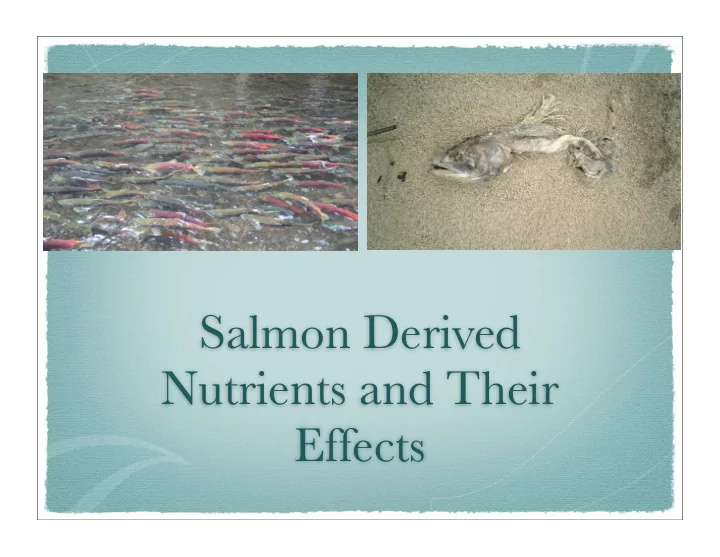

Salmon Derived Nutrients and Their Effects
Mid 1980’s believed salmon carcasses, particularly coho (spawn in steep head water streams), were quickly washed away after spawning, and thus had little effect on freshwater Cederholm tested whether coho would wash downstream, and found that streams complicated by large organic debris from surrounding forest retain most of the carcasses Later in 1993, Kline showed direct evidence of marine nutrients moving into freshwater foodwebs using stable isotopes
Salmon Life History More than 99% of the biomass for adult sockeye is accumulated in the marine environment Thus, nutrients originating Elevated levels of from post-spawning salmon Nitrogen isotope are almost all marine δ 15 N derived
Impacts of Climate Change and Fishing on Pacific Salmon Abundance Over the Past 300 Years (B.P. Finney et al., 2000) Catch records suggest a correlation between: ● Aleutian Low intensity ● Increased coastal sea surface temperatures in the eastern North Pacific ● Increased production of Alaskan salmon However...
Historical records are only so old, and the collected data is too “young” and is complicated by commercial harvesting and habitat alterations, and thus, is to poor of quality to asses the repressentativeness of recent observations i.e. the big problem to address
B.P. Finney et al. collected high resolution records of: ● Diatoms ● Cladocerans ● Sedimentary δ 15 N Why?
To see the sockeye salmon-climate connection over the last ~300 years in sockeye nursery lakes located on western Kodiak Island and near Bristol Bay, Alaska 1. Karluk 2. Frazer (control) 3. Red 4. Akalura 5. Ugashik 6. Becharof 7. Tazimina (control)
Terrestrial δ 15 N in Alaskan nursery lakes typically close to atmospheric levels of 0‰ (compared to ~12‰ found in sockeye salmon) This allows for easy tracking of salmon derived nutrients (SDN) into the biota of freshwater and terrestrial ecosystems by means of measuring stable N isotopes
Evidence of a strong association between zooplankton δ 15 N and SDN loading Subsequent transfer of SDN to higher trophic levels Archived evidence Escapement: density of returning adult salmon to lake ecosystem
Fig. 3. Historical and paleolimnological evidence of sockeye salmon coring, isotope and dating techniques, concentrations of cladoceran Meso-eutrophic Eutrophic Note: S. minutulus/parvus and F. crotonensis are meso-eutrophic to eutrophic indicators, where S. minutulus/parvus increased dominance suggests lower Si:P conditions
Similarities between: δ 15 N diatoms cladocerans sockeye escapement Finney et al. data suggest the prolonged 20th-century collapse of Karluk sockeye fishery is due to reduction in SDN from overharvesting
In early 1800’s, there is a decline in δ 15N, which coincides with the coldest sea surface temperatures (SST) and coastal air temperatures ~1850 and 1920 show an opposite trend between temperature reconstruction and salmon abundance Low δ 15 N in last two decades does not track overall salmon abundance as stocks were managed for constant escapement and harvesting 1980’s, fish bypass introduced in Frazer
In sub-conclusion, ● Large scale forcing from the ocean atmosphere contributes to fluctuations in sockeye abundance ● Complex interactions exist between climate change and sockeye as there is no simple relation between sockeye abundance and SST ● Both climate change and commercial harvesting reduce SDN into nursery lakes, which can lead to decrease in lake productivity and may also influence salmon production
Effects of Salmon Derived Nitrogen on Riparian Forest Growth and Implications for Stream Productivity (J. Helfield and R. Naiman, 2001) Investigated the effects of marine-derived nutrients (MDN, in essence SDN) on riparian ecosystems in two Alaskan watersheds: ● To determine which riparian plants accumulate MDN ● Assess the effects of MDN on the basal area growth of riparian trees Note: Available N is the typical limiting nutrient in area soils
Helfield and Naiman studied two watersheds on Chichagof Island in south east Alaska Kadashan River: Drains ~140km 2 Mean discharge 4.9m 3 /s Pink salmon escapement ranges from 30,000 - 125,000 Indian River: Drains ~ 57km2 Mean discharge 1.8m3/s Pink salmon escapement ranges from 200 - 45,000
Each returning pink salmon carries ~65g of N in its tissue, almost all of which is marine derived, thus, annual spawning migrations bring as much as 8000 and 3000kg of MDN to the Kadashan and Indian Rivers, respectively
The two watersheds were split into spawning and reference (control) sites Each site had 4 transects extending laterally from stream with sampling points at 5, 25, 50 and 100m from active channel, as well as random points between transects, and measured: ● canopy cover ● stem density ● basal area ● overstory species composition ● foliage and increment core samples were taken from nearest canopy Sitka spruce ● collected foliage samples from devil’s club, fern and red alder
Recommend
More recommend