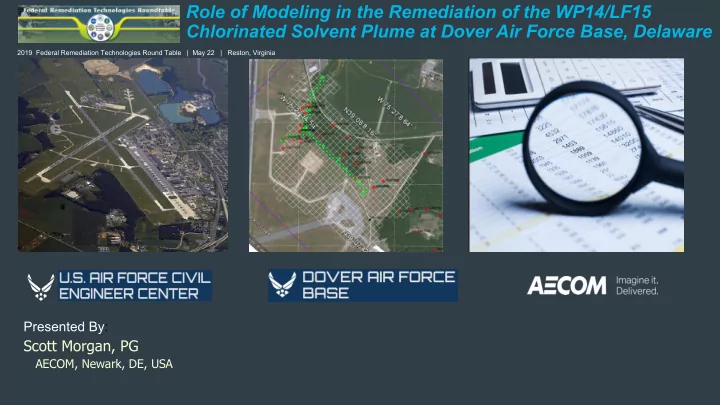

Role of Modeling in the Remediation of the WP14/LF15 Chlorinated Solvent Plume at Dover Air Force Base, Delaware 2019 Federal Remediation Technologies Round Table | May 22 | Reston, Virginia Presented By: Scott Morgan, PG AECOM, Newark, DE, USA
Role of Modeling in the Remediation of the WP14/LF15 Chlorinated Solvent Plume at Dover Air Force Base, Delaware – Introduction – Location and Background – Data Evaluation and Modeling – Source Delineation and Treatment – Summary and Path Forward 2
Introduction This is a case study of the use of various modeling and data evaluation tools to manage and investigate environmentally impacted sites. Two locations at Dover Air Force Base, WP14/LF15 were selected as our case study to show how multiple evaluation tools were employed at various points during a nearly 30-year long project. Models developed across the base and refined to address issues specifically at WP14/LF15 provided greater assurance for implemented and augmented remedial technologies to reach Remedial Action Objectives. 3
Location of WP14 and LF15 General Groundwater Flow Direction Pipe Elm Branch Pipe Elm Branch LF15 North 0 300 600 WP14 Feet 4
Background of WP14 and LF15 – WP14 – Liquid Waste Disposal Pit • Active in late 1950s to early 1960s • Disposed of liquid shop wastes including oils and solvents – LF15 – Landfill • Active during the 1960s • Used for solid waste and small quantities of shop wastes – Early 1960s (precise time frame unknown), sites were covered with soil and grass. No active remediation was conducted. – Environmental investigations revealed a groundwater contamination plume, primarily PCE and TCE and their breakdown products. – Monitored natural attenuation was implemented per 1997 Record of Decision. 5
Environmental Restoration Time-Line First USGS - Assessment AECOM Fate & Environmental Modeling of MNA Transport Predictive DNREC – GMZ Sampling for EMU Sites* Modeling Update 2003 1986 1995 – 96 2016 AECOM Fate & USGS Regional Transport DAFB 3D Predictive Groundwater Flow Model** Modeling 2013 1997 – 99 1997 2000 - 01 2012 Monitoring MNA ROD USGS Mass Flux Source Continues signed Study *** Delineation 2015 1993 – 94 1999 ROD Amendment RI Sampling Monitoring --------- begins AAB Source Area Injection * Published in 1998 ** Published in 2000 *** Published in 2001 6
Plume over Time 7
Trend Evaluation of MNA for meeting RAOs Trends indicate excessive time to reach RAOs (< 5 ug/L) 1994 2012 8
Simulated PCE Plume Assuming no Source Area T = Present (1994), source removed T = Source removed + 10 years General Groundwater Flow Direction T = Source removed + 30 years T = Source removed + 20 years 9
Source Delineation and Treatment • 77 locations across WP14 and LF15 • Evidence of previously unknown source material • Highest PCE Concentration = 29,822 µg/L • Carbon injections in AAB treatment area in 2015 10
Source Area Well Trend Graph Injection 11
Fate and Transport Modeling – Graphical trend analysis has been used for plume monitoring since 2003. – More robust numerical modeling was performed, starting in 2013, to provide information on the fate and transport of COCs and time to reach RAOs. – Site data were used to calculate site-specific degradation rates. Degradation rates were refined through iterative model runs to best fit observed constituent distributions using both reactive (RT3D) and non-reactive (MT3DMS) model codes. – At WP14/LF15, graphs of COC trends in source area wells were used to predict when source area concentrations would fall below RAOs. – Model runs with calibrated parameters and assuming no continuing source were used to estimate when the dissolved plume areas would fall below RAOs. – Modeling indicated that total time to reach RAOs 20+ years after source area is remediated (about 15 years estimated from trend charts). 12
Updated Simulated Concentrations over Time Mid-Plume Distal End WP14/LF15 WP14/LF15 Simulated concentrations drop below RAOs in approximately 15 to 20 years 13
Summary – WP14/LF15 was selected as our case study to show how multiple modeling tools were employed at various points during a nearly 30-year long project. • Early on, USGS models provided foundational understanding of F&T and support of remedy selection. – Previous modeling exercises at modeling studies at DAFB indicated the importance of understanding source area conditions for overall plume persistence. – Concentration trends inconsistent with model results raised concerns that RAOs would not be met in reasonable time frame and that source area conditions may be different than expected at WP14/LF15. – Subsequent source area investigation identified mass remaining in source area which was treated using – Refined 3D Fate and Transport modeling and Trend analysis supported a change to the existing remedy. 14
Path Forward – Continue annual plume monitoring and evaluation of concentration trends as compared to predicted changes. – Enhance the Conceptual Site Model through Environmental Sequence Stratigraphy (ESS) – When RAOs are reached, use statistical analysis or modeling to demonstrate sustainable achievement of RAOs 15
2019 Federal Remediation Technologies Round Table | May 22 | Reston, Virginia Thank You! Scott Morgan, PG AECOM, Newark, DE, USA T 302.781.5935 E scott.a.morgan@aecom.com
Recommend
More recommend