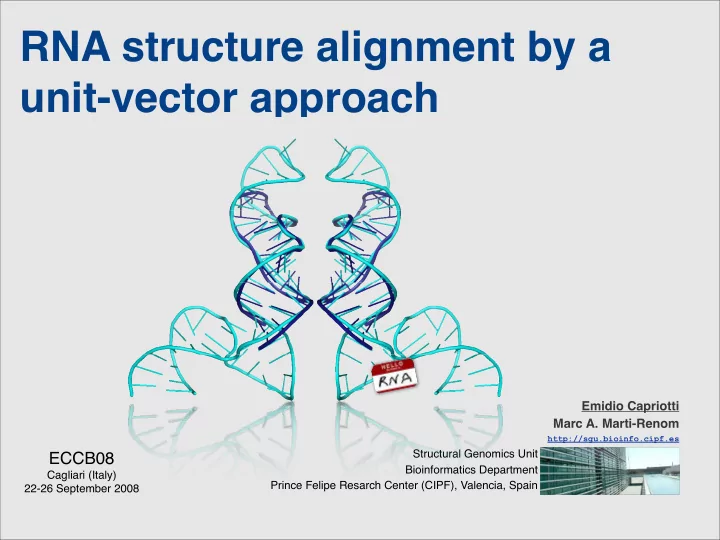

RNA structure alignment by a unit-vector approach Emidio Capriotti Marc A. Marti-Renom http://sgu.bioinfo.cipf.es Structural Genomics Unit ECCB08 Bioinformatics Department Cagliari (Italy) Prince Felipe Resarch Center (CIPF), Valencia, Spain 22-26 September 2008
RNA structure The PDB database contains ~1,500 RNA structures. − All http://www.pdb.org − X-ray − NMR 2
RNA structure datasets RNA STRUCTURE * 1,101 RNA CHAINS 2,179 Non-Redundant RNA CHAINS ** 708 NR95 RNA CHAINS (20 ≤ Length ≤ 310) 277 SCOR SCOR SET *** 60 HR HIGH RESOLUTION RNA SET **** 51 * from PDB November 06 . ** non-redundant 95% sequence identity *** SCOR functions with at least two chains **** resolution below 4.0 Å and with no missing backbone atoms. 3
Dataset distribution 407 of <20n tRNA 20 of >1,000n 4
Unit Vector i+3 i+1 i+2 i i+2 i+1 i 10 7 5 7 10 4 5 4 10 Ortiz et al. Proteins 2002 5
Atom selection The best backbone atom that represents the RNA structure has been selected by evaluating the distribution of the distances between consecutive atoms in structures from the NR95 set. 6
Background distribution Considering a dataset of 300 random RNA structures, we have produced ~45,000 pairwise alignments that resulted in a empirical distribution. From such distribution we can then evaluate μ and σ needed to calculated the p-value for P(s ≥ x). Empirical Analytic P ( s ≥ x ) = 1 − exp( − e − λ ( s − µ ) ) Karlin and Altschul PNAS 1990 7
Random RNA The RNA backbone can be described given the 6 torsion angle ( α , β , γ , δ , ε , ζ ) for each nucleotide. The RNA backbone is rotameric and only 42 conformation have been described from a set o high resolution structures . 50 µ =763* N -0.896 Murray et al PNAS 2003 � =180* N -1.010 40 We divided the resulting structural alignments 30 ( ∼ 45,000) in 30 bins according to the minimum μ and σ sequence length of the two random structures ( N ). 20 For each bin the μ and σ values are evaluated fitting the data to an EVD. 10 The relations between N and μ , σ values are extrapolate fitting them to a power low function 0 (r ≈ 0.99). 0 50 100 150 200 250 300 N (Length of the shorter RNA structure) 8
Optimization The accuracy of SARA method depends of a large number of parameters. • C3 ʼ and P backbone atoms for the unit vectors evaluation, • k number of consecutive unit vectors, spamming from 3 to 9 and, • values of gap opening from -9 to 0 and gap extension for -0.8 to 0 • Secondary structure information Gap opening Gap extension k Secondary structure -7.0 -0.6 3 No secondary structure -8.0 -0.2 7 9
PSI distribution all-against-all comparison of structures in the NR95 set tRNA 10
Statistical significance all-against-all comparison of structures in the NR95 set 11
Comparison with ARTS all-against-all comparison of structures in the HR set SARA Percentage of structure identity (PSI) 92.6% Percentage of sequence identity 48.0% Percentage of SSE identity 100.0% RMSD 1.78 Å >1q96 Chain:A -------------------ggugcucaguaugag--------aagaaccgcacc------- >1un6 Chain:E gccggccacaccuacggggccugguuaguaccugggaaaccugggaauaccaggugccggc ARTS Percentage of structure identity (PSI) 76.9% Percentage of sequence identity 20.0% Percentage of SSE identity 79.2% RMSD 1.66Å PSI: % of structure identity PSS: % of secondary structure identity >1q96 Chain:A --------------------gugcucaguaugaga-----aga-accgcacc-------- Cut-off distance: 4.0 Å >1un6 Chain:E ccggccacaccuacggggccugguuaguaccugggaaaccugggaauaccaggugccggc 12
Function assignment all-against-all comparison of structures in the SCOR set Rank of deepest SCOR function Rank of related SCOR function 13
SARA server http://sgu.bioinfo.cipf.es/services/SARA/ 14
All against all alignments A set of 829 RNA chain structures from PDB (Jan 08) has been selected to study the relationship between sequence and structure similarity. -LNE>5 -LNE ≤ 5 %ID PSI N N 15
Sequence similarity distribution Using the subset of alignments with -LNE ≤ 5 we evaluate the background distribution for the percentage of sequence identity (%ID) -LNE>5 -LNE ≤ 5 − μ = 271.4 ∗ N -0.8862 − σ = 114.7 ∗ N -0.8591 μ and σ %ID N N 16
RNA sequence and structure The plot shows that tertiary structure is more conserved than sequence. r=0.84 PSI y = -0.013x 2 +2.24x+6.34 %ID 17
Conclusions and future directions • The SARA method is a good alternative to other RNA structure alignment methods. • The statistics obtained using the alignments between random generated structures have allowed to select high quality alignment. • The subset of alignments with log(p-value) ≤ 5 has been used to evaluate the minimum level of sequence identity that corresponds to the conservation of the 3D structure. • The RNA tertiary structure is more conserved than sequence. • Develop new strategies to represent RNA secondary structure to improve the quality of the alignments • A set of high quality alignments will be selected to derive the rules for the prediction of new RNA structures relying on sequence-structure alignment information. 18
Acknowledgments MAMMOTH ALGORITHM Structural Genomics Unit (CIPF) Angel Ortiz Marc A. Marti-Renom ARTS PROGRAM Davide Bau Oranit Dror Emidio Capriotti Ruth Nussinov Haim J. Wolfson ECCB08 Travel Fellowship granted by BIOSAPIENS Network of Excellence FUNDING Prince Felipe Research Center Marie Curie Reintegration Grant STREP EU Grant Generalitat Valenciana MEC-BIO http://sgu.bioinfo.cipf.es Ángel Ramirez Ortiz, June 30th 1966 - May 5th 2008
Recommend
More recommend