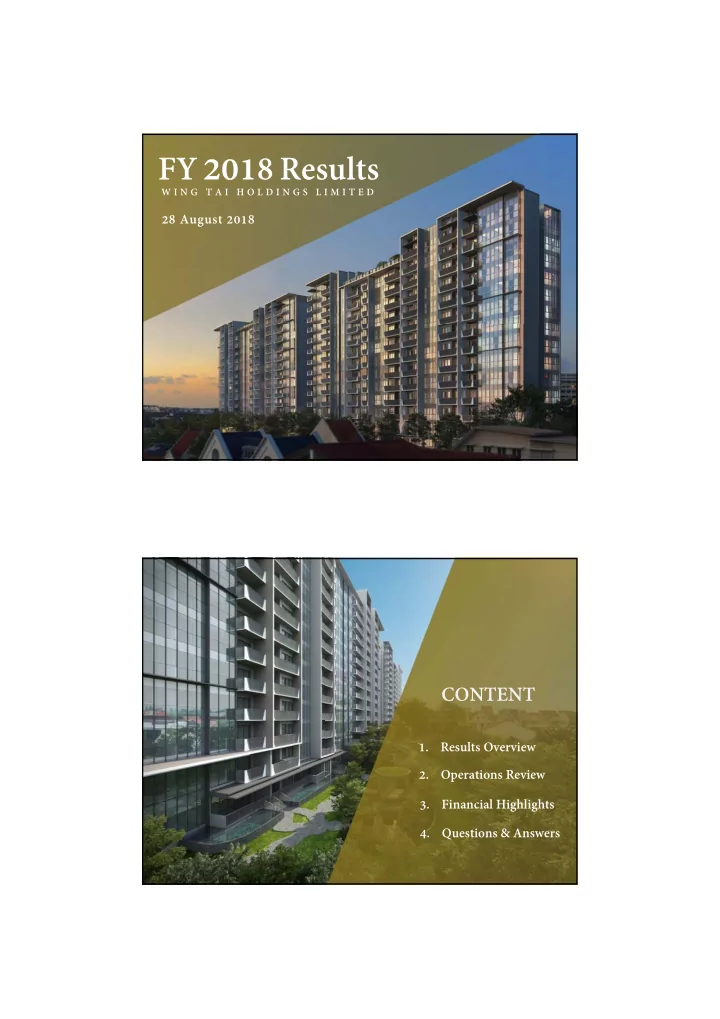

FY 201 8 Results W I N G T A I H O L D I N G S L I M I T E D 28 August 2018 1 CONTENT 1. Results Overview 2. Operations Review 3. Financial Highlights 4. Questions & Answers 2
Results Overview 3 Key Highlights for FY 2018 Revenue S$373.2 million Net Profit Attributable to Shareholders S$218.8 million 4
Key Financial Ratios FY 2018 FY 2017 EPS (cents) 27.5 2.6 NTA per share (S$) 4.31 4.07 Net gearing ratio (times) Net Cash 0.02 5 Revenue & EBIT by Business Segments for FY 2018 Revenue EBIT S$ M S$ M 66.9 Development Properties 192.2 Investment Properties 35.9 197.7 Retail 136.1 34.3 6
Asset Allocation by Business Segments & Geographical Locations as at 30 June 2018 By Business By Countries Malaysia 14% Development Properties China 51 % 4% Australia 3% Retail Singapore 4% 43% Hong Kong 36% Investment Properties 45% Total Assets = S$4.5 billion 7 Operations Review 8
Development Properties FY 2018 FY 2017 S$ M S$ M Revenue 192.2 76.4 EBIT / (Loss) 66.9 (15.7) 9 Residential Properties Sales in FY 2018 Units Sold Sales Value S$ M Singapore 202 522 Malaysia 126 51 China 24 30 Total 352 603 10 10
Investment Properties FY 2018 FY 2017 S$ M S$ M Revenue 35.9 35.1 EBIT 197.7 87.8 11 11 Financial Highlights 12 12
Summary Financial Highlights FY 2018 FY 2017 S$ M S$ M Revenue 373.2 263.2 Operating profit / (loss) 60.3 (11.8) 211.6 Share of associate / JV profits 73.4 Finance costs (32.5) (41.9) Tax & non-controlling interests (20.6) 0.4 Net profit 218.8 20.1 13 13 Balance Sheet 30 June 18 30 June 17 S$ M S$ M Current assets 1,574 1,991 2,958 Non-current assets 2,625 Current liabilities (151) (216) (831) Non-current liabilities (984) Net assets 3,550 3,416 3,330 3,147 Shareholders’ funds Non-controlling interests 72 121 Perpetual Securities 148 148 3,550 Total equity 3,416 14 14
Borrowings 30 June 18 30 June 17 S$ M S$ M - Current 4 780 926 Non-current Total borrowings 780 930 Cash & cash equivalents (792) (847) Net Cash Net borrowings 83 Net gearing ratio (times) Net Cash 0.02 15 15 Dividend FY 2018 Dividends per share (cents) 3.0 - Ordinary - Special 5.0 8.0 Dividend yield (%) * 4.0% * Based on share price prior to the date of results announcement. 16 16
17 17 Q uestions & Answers 18 18
Recommend
More recommend