Results and conclusions of Integrity Surveys Jnos Szatmri , project - - PDF document

results and conclusions of integrity surveys
SMART_READER_LITE
LIVE PREVIEW

Results and conclusions of Integrity Surveys Jnos Szatmri , project - - PDF document

Mr. Jnos Szatmri, SAO of Hungary Results and conclusions of Integrity Surveys Results and conclusions of Integrity Surveys Jnos Szatmri , project manager State Audit Office of Hungary Szarvas, 24.02.2016 Main topics Development of


slide-1
SLIDE 1

Results and conclusions of Integrity Surveys

  • Mr. János Szatmári, SAO of Hungary

Results and conclusions of Integrity Surveys

János Szatmári, project manager State Audit Office of Hungary Szarvas, 24.02.2016

Main topics

  • Development of the participation in the survey

(2011-2015)

  • Calculating risk indexes for each institutions
  • Development of the national average of the three

indexes (2013-2015)

  • Special focuses of the analyses of the 2015

survey results

  • Main conclusions of the analyses

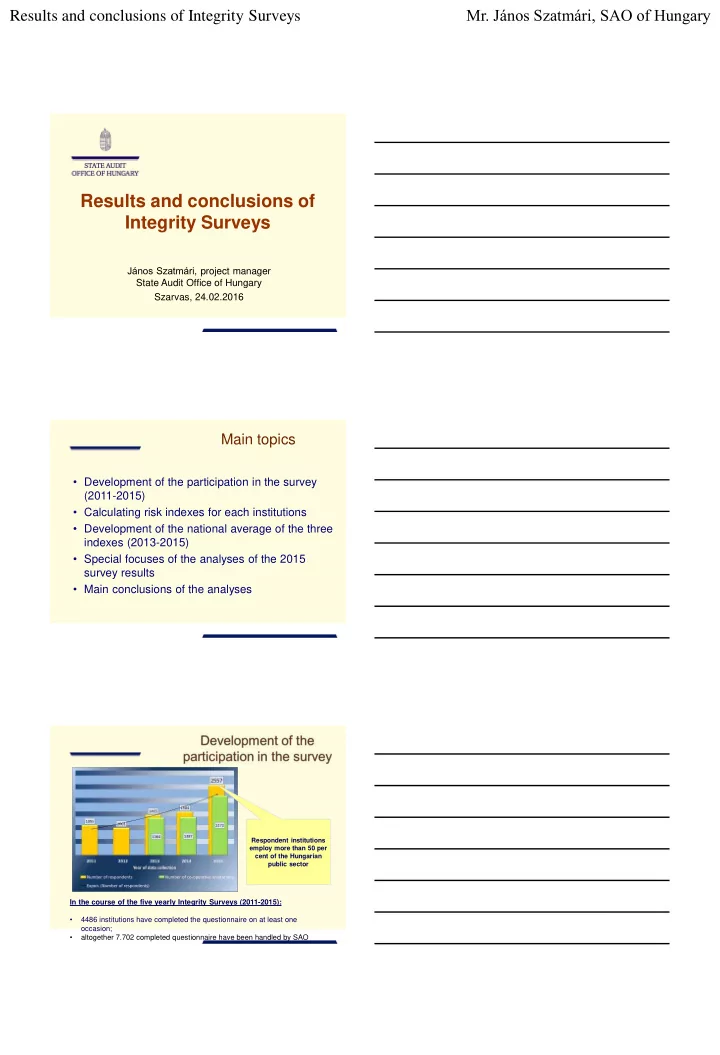
In the course of the five yearly Integrity Surveys (2011-2015):

  • 4486 institutions have completed the questionnaire on at least one
  • ccasion;
  • altogether 7.702 completed questionnaire have been handled by SAO

Respondent institutions employ more than 50 per cent of the Hungarian public sector

slide-2
SLIDE 2

Results and conclusions of Integrity Surveys

  • Mr. János Szatmári, SAO of Hungary

The most questionnaires came from

Local Governments 1119

Institutions providing social services

276

Nurseries, kindergartens 303

Law enforcement 119

Risk indexes for institutions For public sector institutions participating in the survey

  • Risk indexes are calculated for each

participant (”mirror image”)

  • Measure and compare
  • Providing basis for improvement
  • Dissemination of integrity approach

„Mirror image” for the institutions

slide-3
SLIDE 3

Results and conclusions of Integrity Surveys

  • Mr. János Szatmári, SAO of Hungary

CORRUPTION RISK MAP

Visualisation of the results on digital map: (search & compare)

INTEGRITY PORTAL Analyzing survey results Risk indexes are also calculated

  • for the total number of respondents (overall indexes)
  • for groups of institutions

Analyses

  • Survey results provide plentiful
  • pportunities for analyzing

corruption risks and integrity controls at the public sector institutions

  • The answers to each

question of the questionnaire can be analyzed

  • Tracking changes
slide-4
SLIDE 4

Results and conclusions of Integrity Surveys

  • Mr. János Szatmári, SAO of Hungary

Index values for 2015 vs. indicators for 2013 and 2014 weighted with 2015 participation data (%)

Gradual increase in the level of controls Gradual decrease in risk level

Change of overall indexes 2013 and 2015 (%) Name of index 2013* 2015 Change (percent point) IVI 35,1% 31,8%

  • 3,3

EFI 23,6% 21,9%

  • 1,7

EoCI 58,3% 60,4% +2,1 *Index values weighted with 2015 participation data Highest Inherent Vulnerability Index levels

slide-5
SLIDE 5

Results and conclusions of Integrity Surveys

  • Mr. János Szatmári, SAO of Hungary

Highest Enhanced Factors Index levels Highest Existence of Controls Index levels

Analyses of 2015 Survey data

Annual evaluation report summarising the results

  • f the Integrity Survey

Special focuses of the 2015 evaluation report:

  • Application of special anti-corruption systems

and procedures and „soft” integrity controls

  • Corruption

risks and controls in public procurement

slide-6
SLIDE 6

Results and conclusions of Integrity Surveys

  • Mr. János Szatmári, SAO of Hungary

Controls

Survey year 2014 2015 A whistleblowing management system is in place within the

  • rganisation

33.1% 38.0% The organisation has a Code of Ethics 44.4% 49.2% The “two-man rule” is applied 51.4% 55.6% There is a system in place to manage external complaints 35.8% 38.6% Data regarding the financial management of the organisation are publicly available 94.1% 94.7% Anti-corruption training was held in the last three years 23.2% 24.9% The organisation has workplace rotation 13.5% 14.8% Corruption risk analysis is performed regularly 14.5% 13.9%

Legend: Green: A positive change, indicating an increase in the ratio of institutions applying the given control. Red: A negative change, indicating a decline in the ratio of institutions applying the given control.

Special anti-corruption systems and procedures Change in adopting special anti-corruption controls 2014-2015 The proportion of institutions have been increasing, that …

Controls

Survey year 2014 2015 Ratio of institutions regulating the conditions of accepting gifts, invitations and trips 27.6% 31.7% Ratio of institutions presenting in publicly disclosed strategies any of the following topics: improving organisational culture, strengthening integrity, fight against corruption 57.7% 60.2% Ratio of institutions stipulating a reporting obligation for employees on conflicts of interests with economic or any

  • ther relevance

58.4% 60.7% Ratio of institutions operating an individual performance assessment system affecting income levels* 29.8% 28.8%

Legend: Green: A positive change, indicating an increase in the ratio of institutions applying the given control. Red: A negative change, indicating a decline in the ratio of institutions applying the given control.

"Soft" controls

*Data presented in the table include institutions responding with “yes”, “mostly yes” and “barely” to the question of whether they operate individual performance assessment systems affecting income.

slide-7
SLIDE 7

Results and conclusions of Integrity Surveys

  • Mr. János Szatmári, SAO of Hungary

The proportion of institutions have been increasing, that … Alkalmazott „lágy” kontrollok változása 2014-2015

77,2% systematically examining the compliance

  • f public procurement of

goods or services 86,15% not having special policy for hiring external experts 62,4% no rule at all for liaising with third parties 88,7% regulating in some form the matter of conflict of interests. 31,7% regulating the acceptance of various gifts, invitations and travels 62,8% require staff to declare any relevant economic or other interests 94,5% disclosing financial management data to public

Risks and controls in public procurement (2015)

Data show the delvelopment of controls concerning public procurements.There is room for further development.

Regulation on the involvement of external experts

86,2% not having a special policy for hiring external experts

slide-8
SLIDE 8

Results and conclusions of Integrity Surveys

  • Mr. János Szatmári, SAO of Hungary

Risk factors Cases in the last 3 years where the same bidder was awarded multiple public contracts Survey year 2015 2014 Frequency (case) more than 3 1-3 more than 3 1-3 Cases in the last 3 years where fewer than three bidders participated in the institution’s public procurement procedure 2015 More than 3 10.1% 1.5% 1-3 5.4% 10.3% 2014 More than 3 8.9% 4.2% 1-3 1.9% 10.0%

Linkages between the risk factors associated with public procurement

Increasing risks have been registered comparing to previous survey results

SUMMARY I.

  • The high(increasing) participation of public sector

institutions in the Integrity Survey

  • f

SAO demonstrates the commitment of the Hungarian institutional system to the fight against corruption and to strengthening integrity

  • According to the surveys corruption risk indicators

show a decreasing trend overall, with a paralell increase in the level of controls. This indicates an improvement in the management of corruption risks among participating institutons.

Summary II.

  • The favorable shift in the control indicator reflects a gradual,

simultaneous, moderate increase in the coverage

  • f

several controls.

  • Significant improvement was achieved among others in the application of

special anti-corruption controls:

  • Special anti-corruption controls

(e.g. Code of Ethics, two man rule,whistleblowing system) and

  • „Soft” integrity controls (e.g. the regulation of the acceptance of gifts,

trips and invitations, the reporting obligation of employees regarding conflict of interests)

  • Further steps are requiered among others in the application:
  • Regular corruption risk analyses,
  • Anti corruption training
  • Rotation in vulnerable positions.
slide-9
SLIDE 9

Results and conclusions of Integrity Surveys

  • Mr. János Szatmári, SAO of Hungary

Utilization of the surveys’ results

  • Presenting a ‘mirror image’ for the institutions participating in the

survey

  • Providing basis for them to develop their integrity management

system

  • Raising risk awareness and improving risk management at the

institutions

  • Adapting the results into the audit work of the SAO
  • Contributing to a new integrity based culture in the public sector
  • The integrity-based approach has become one of the pillars of the

anti-corruption measures of the government.

Thank you for your attention!