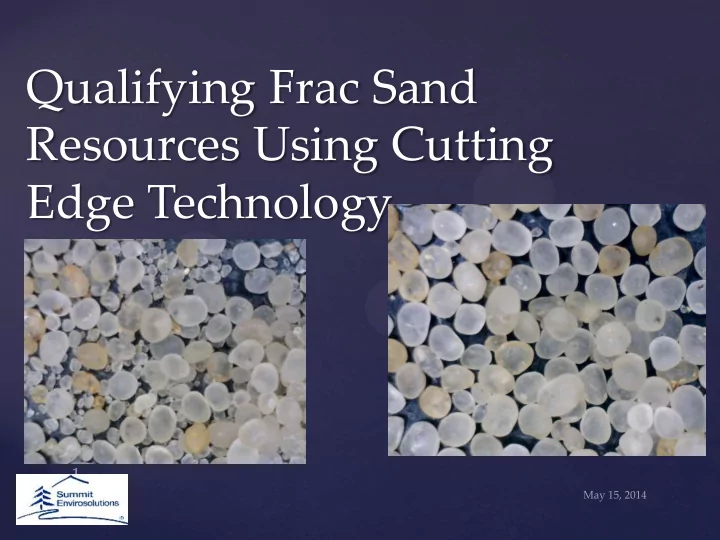

Qualifying Frac Sand Resources Using Cutting Edge Technology
Sample prep & handling Data correlation PSD as decision tool PSD for “fingerprinting”
Conclusions Camsizer Quick Reliable 21 st Century upgrade for PSD and more Sample Handling Key to Reproducible Results Natural variability on material is different that manufactured product Use statistics & trend charts for big data sets vs. time
Prospecting
ISO 13503-2/API 19/56
*Gert Beckmann Retsch Technology
“representative sample….” • Analyzing Representative Samples • Standardizing Testing ….. Methods { Techniques Equipment • Quality Assurance/Quality Control - QA/QC
Camsizer vs. Rotap learnings NEVER scoop always use sample splitter No mechanical agitation like RoTap Clusters and “coating” source for discrepancy Smaller sample size – unforgiving!!
Sample prep Air dry Split & weigh Wash, wet sieve – P200 Dry and calculate %loss Micro photograph Archive sample
Gradation Analysis {
Proving the “method…” • Creating a “standard” sample • Splitting “standard” sample – maintain representative • Confirm to “ISO equivalence” • Establish statistically significant like vs. different
Split sample into 5 parts. 4 splits used for ro-tap. 1 split used exclusively for CAMSIZER Run 3 of 4 samples in the ro-tap individually - once (saved 2, 3 and 4 to run through the CAMSIZER) Run 4th sample three times through ro-tap Split the one sample used for the CAMSIZER into 4 smaller parts Run 3 of 4 samples through the CAMSIZER once Run the 4th sample through the CAMSIZER three times Run sample 2, 3, and 4 from the ro-tap through the CAMSIZER
Same split sample using sieves
Same sample 3x Rotap
Same sample 3x Camsizer
All sets of Rotap data
All Sets of Camsizer data
Average of all Camsizer - Blue Rotap - Red
Round/Sphericity ….Proving the “method…”
Roundness/Sphericity
Site 1 Site 2 Site 3 Site 4 Sieve Size (US % Retained Roundness Sphericity % Retained Roundness Sphericity % Retained Roundness Sphericity % Retained Roundness Sphericity Standard) 0.92 0.96 0.4 0.91 0.87 0.3 0.91 0.87 0.6 0.67 0.86 #16 0.1 0.83 0.88 0.4 0.87 0.90 0.7 0.87 0.90 1.1 0.84 0.88 #18 0.1 0.75 0.85 1.1 0.83 0.87 1.5 0.83 0.87 1.7 0.85 0.85 #20 0.8 0.77 0.81 3.5 0.77 0.83 4.1 0.77 0.83 4.1 0.82 0.83 #25 2.2 0.78 0.83 5.2 0.82 0.83 7.2 0.82 0.83 6.3 0.80 0.78 #30 6.6 0.76 0.78 9.1 0.79 0.78 11.5 0.79 0.78 8.8 0.78 0.76 #35 14.6 0.73 0.77 10.2 0.79 0.77 12.7 0.79 0.77 9.7 0.76 0.76 #40 17.6 0.74 0.75 12.9 0.76 0.76 14.2 0.76 0.76 11.6 0.72 0.75 #45 22.9 0.70 0.72 10.2 0.72 0.73 11.4 0.72 0.73 10.2 0.68 0.73 #50 20.0 0.65 0.71 8.2 0.67 0.72 9.6 0.67 0.72 10.2 0.65 0.72 #60 10.3 0.61 0.70 5.3 0.63 0.70 5.7 0.63 0.70 7.2 0.62 0.71 #70 2.2 0.34 0.63 7.9 0.23 0.49 6.4 0.23 0.49 9.3 0.49 0.61 #100 0.8 0.19 0.54 16.5 0.22 0.43 8.1 0.22 0.43 11.3 0.24 0.38 #200 0.4 9.2 6.6 8.0 PAN 1.5 20/40 41.0 0.7595 0.797 28.0 0.79275 0.79925 35.6 0.79275 0.79925 28.9 0.79175 0.784 30/50 75.1 0.7 0.8 42.4 0.8 0.8 49.8 0.8 0.8 40.3 0.7 0.8 40/70 55.3 0.7 0.7 36.6 0.7 0.7 40.9 0.7 0.7 39.2 0.7 0.7 4 sites
GradStat8
GradStat8
GradStat8 – cont.
Planning
{
{
ArcGIS – Raster block allows x,y,z arithmetic {
Block modeling
{
Data used to build….. • 3d model of subsurface • Estimate potential resource quantity • Data gaps, uncertainty & risks • Risk/benefit of additional data collection • Resource Valuation Model ($$$)
Ideal Proppant …. • Stronger than diamonds • Lighter than water • Cheaper than dirt • Available everywhere
Tom Gapinske Summit Envirosolutions 1217 Bandana Blvd. N St. Paul MN 55108 (651) 472 2468 tgapinske@summite.com
Recommend
More recommend