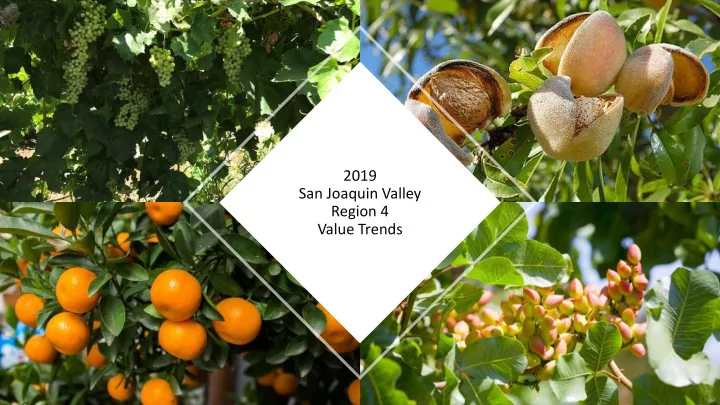

2019 San Joaquin Valley Region 4 Value Trends
Historical Almond Value Trends 2000-2019
Current Almond Values • $14,000 - $35,000 per acre • East Side (District Water) - $27,000/acre - $38,000/acre • Value Trend: Stable • East Side (No District Water) - $16,000/acre - $28,000/acre • Value Trend: Decline • West Side - $10,000/acre - $19,000/acre • Value Trend: Stable
Historical Pistachio Value Trends 2000-2019
Current Pistachio Values • $ 17,000 - $36,000 per acre • $17,000/acre - $20,000/acre Madera Water District with Atlantica Rootstock • $28,000/acre- $36,000/acre Mature Orchards with Newer Rootstock • Stable Value Trend
Historical Tree Fruit Value Trends 2000-2019
Current Tree Fruit Values • $ 22,000 - $32,000 per acre • Strong Demand with Limited Activity • Few Sales Listed – Most Traded Privately
Historical Citrus Trends 2000-2019
Current Citrus Values • $ 22,000 - $38,000 per acre • Slig Slightly ly In Increas asin ing Val alue Trend • Dem Deman and St Strongest for or Man andar arins and Sp Special alty Cr Crop ops
Historical Vineyard Trends 2000-2019
Current Vineyard Values • $14,000 - $35,000 per acre • Vineyards with Dual Water Sources - $26,000/acre - $35,000/acre • Value Trend: Stable • Vineyards with a Single Water Source - $14,000/acre - $23,000/acre • Value Trend: Decline • Demand Driven by Land Available for Higher Income Producing Permanent Crops
Historical Irrigated Field Cropland Trends 2000-2019
Historical Irrigated Field Cropland Trends 2000-2019
Historical Irrigated Field Cropland Trends 2000-2019
Historical Irrigated Field Cropland Trends 2000-2019
Historical Irrigated Field Cropland Trends 2000-2019
Current Irrigated Field Cropland Values • Fresno County (USBR – West) - • Madera County (District) • $5,500/acre - $8,500/acre • $16,000/acre - $23,000/acre • Value Trend: Stable • Value Trend: Stable • Fresno County (Exchange Contractor Districts) - • Madera County (Well Water, No District) - • • $10,000/acre - $20,000/acre $8,000/acre - $14,000/acre • Value Trend: Stable • Value Trend: Stable • Fresno County (Districts) - • $11,000/acre - $32,000/acre • Value Trend: Stable - Increasing • Fresno County (Well Water, No District) - • $8,000/acre - $16,000/acre • Value Trend: Stable
Historical Rangeland Trends 2000-2019
Current Rangeland Values • Westside - $300/acre - $1,000/acre • Value Trend: Stable • Eastside - $900/acre - $2,500/acre • Value Trend: Stable
Historical Dairy Trends 2000-2019
Current Dairy Values • Newer Facilities (Per Lactating Cow – Without Underlying Land) - $1,400/cow - $2,400/cow • Value Trend: Stable • Older Facilities (Per Lactating Cow – Without Underlying Land) - $700/cow - $1,400/cow • Value Trend: Stable • Very Limited Market Activity
• Kristin Massetti, ARA (Co-Chair) Region 4 Land • Jaime Bigham, ARA (Co-Chair) • Ryan Metzler, AFM Value Trends • Matt Pennebaker, ARA Committee • Julie Rose-Gonsalves
Recommend
More recommend