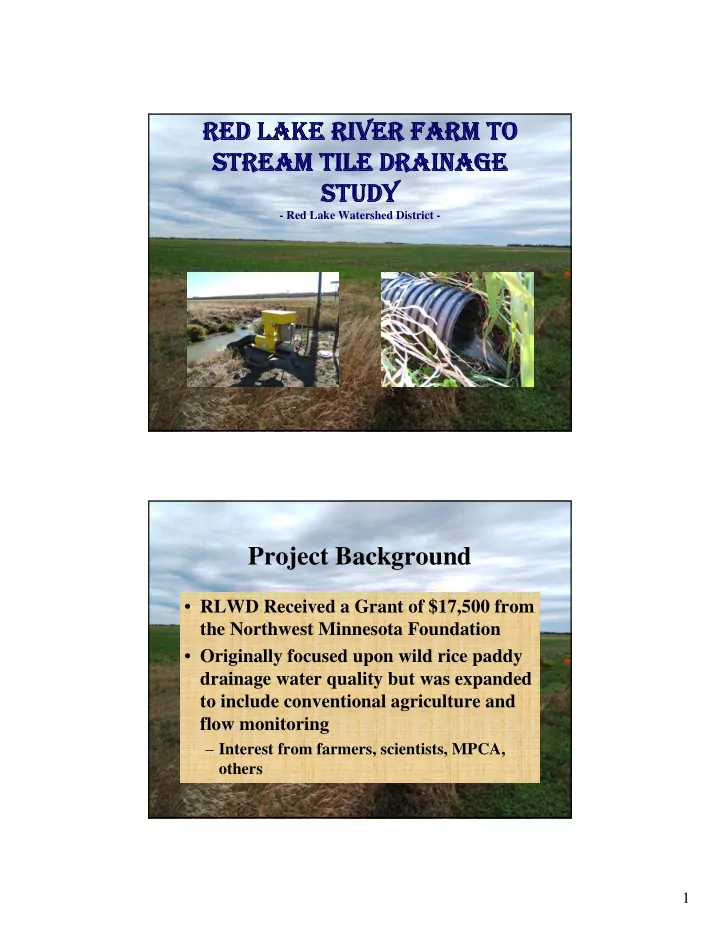

RED LAKE RIVER FARM TO RED LAKE RIVER FARM TO STREAM TILE DRAINAGE STREAM TILE DRAINAGE STUDY STUDY - Red Lake Watershed District - Project Background • RLWD Received a Grant of $17,500 from the Northwest Minnesota Foundation • Originally focused upon wild rice paddy drainage water quality but was expanded to include conventional agriculture and flow monitoring – Interest from farmers, scientists, MPCA, others 1
Project Background • Red River Watershed Management Board – Took interest in the project – Wanted flow measurement – Provided funding for accurate flow monitoring • The Marshall/Beltrami SWCD received a grant for tile drainage sampling – Paid for sampling and analysis in Beltrami County – We were able to include more sites in the study RLWD Project Partners • Northwest Minnesota Foundation • Red River Watershed Management Board • Red Lake Nation DNR • Marshall/Beltrami County SWCD • Red Lake County SWCD • Stanley Farms • Sparby Farms • Bachand Farms • Red Lake Nation Wild Rice Paddies • HDR Engineering 2
Data Collected • Water quality samples and field measurements • Flow measurement • Rainfall, baro, and temp • Crop and fertilizer usage • Land use, drainage area, soils, and other spatial data about the project sites Water Quality Comparisons • Conventional Agriculture – Different types of tile outlets – Different areas within the Red Lake River Watershed – Tile Drainage vs. Surface Drainage vs. Natural Background WQ • Wild Rice Paddy Drainage – Different types of drainage systems 3
Water Quality Sites • Marshall County (near Grygla) – Gravity tile, pumped tile, surface drainage, “reference” natural background site • Red Lake County near Brooks – Tile and surface drainage from tiled field – Surface drained field • Clearwater County Hangaard Township – Red Lake Nation wild rice paddies • Completely surface drained • Combination of tile and surface drainage • Completely tile drained (pattern to main line, out of the paddy to a grassed waterway) Marshall County Sites 4
Red Lake County Sites Clearwater County (Wild Rice) Sites 5
Water Quality Sampling • Parameters – Total Phosphorus – Orthophosphorus – Nitrates – Total Nitrogen – Total Suspended Solids • Frequency – At least bi-weekly, more frequent during high flow events – Sampling during runoff events is essential – Wild rice paddies sampled intensively during drawdown in late July, early August Tile Water Quality Findings So Far – Dry Land Ag • Very low turbidity – <1 NTU – Often similar to distilled water • Minimal Phosphorus and Total Suspended Solids – TP interferences • Nitrates range from mid-teens to over 40 mg/L – Drinking Water Standard is 10 mg/L – Mud River – 0.43 mg/L avg., 3.16 mg/L max – Hill River – 0.61 mg/L avg., 1.84 mg/L max – RRV ecoregion - .20 mg/L • Good DO levels, but high conductivity 6
Surface Drainage Water Quality • Not many samples in 2005 • Significantly higher turbidity levels vs. tile drainage – sometimes extreme • Higher orthophosphorus • Higher total Kjeldahl nitrogen • Lower nitrate concentration Wild Rice Paddy Water Quality Results 7
Wild Rice Paddy Water Quality Results • Main line tile had much cleaner water than the surface drained paddy and the tile & sfc drained paddy Wild Rice Paddy Water Quality Results • Simply having tile within a paddy is not enough to achieve WQ benefits – Need main line tile – Eliminate internal surface drainage • Wild rice paddy sites had low nitrate levels – Saturated/ponded conditions? – Plant Uptake? • Main line tile nearly meets drinking water standards. Occasional measured suspended solids could be due to mineral buildup on inside of outlet/pipe 8
Wild Rice Paddy Water Quality Results • Incentives for the installation of main line tile in wild rice paddies would drastically improve water quality within the Clearwater River during the discharge months of Jul-Sept. • Benefits to Farmer – More even quality, maturity – Less ditch maintenance – Fewer ruts during harvest – More control over drainage – No topsoil loss Flow Comparisons Accurate, continuous measurement of flow – Tile Drained Field – Surface Drained Field – Onset HOBO Level Loggers • Need to quantify both surface and tile flow from the tile drained field. 9
Flow Comparisons • Needed to find a field or part of a field in which all drainage can be measured, preferably at a single point • Site selection was a longer and more difficult than anticipated at the start of the project • Compare peak flow & total flow between the two types of drainage How will surface flow be measured? • H flumes – Yaggie 2 Surface Drained Field – Sfc Drainage from Bachand Tiled Field 10
How will tile flow be measured? • Water control structure w/ v-notch weir Flow Monitoring Results • Late start in 2005 – will get a more complete record in 2006 • Surface drainage is “flashy” • Tile drained field – Very little surface runoff • Tile drainage – storage in soil • Field was plowed perpendicular to flow – Delayed drainage during a storm • Flow from tile continues long after a storm 11
Flow Monitoring Results Future Monitoring Plans • Late start in 2005, but we now have a really good set of sites – start ASAP during spring runoff in 2006 • Begin recording the amount of sfc. and tile drainage from the flow monitoring sites. • Repeat RLN wild rice paddy sampling – quantify flow from main line tile site • Involve the Red Lake County SWCD • Official report of findings this Fall • Possible continuation of some monitoring – especially flow 12
Questions? 13
Recommend
More recommend