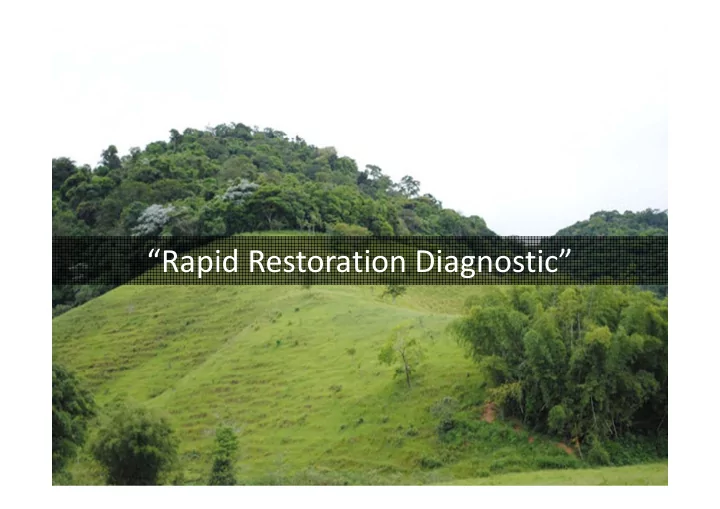

“Rapid Restoration Diagnostic”
Motivate
Enable
Implement
++ Urgent Urgent Not easy Easy Urgency Not urgent Not urgent Not easy Easy - - Ease of implementation - - ++
IUCN/WRI Enabling Conditions Diagnostic e.g. Rwanda
Assessing economic impacts of restoration and building a carbon abatement curve – Take away messages
1
Slide 8 1 Michael Verdone, 3/14/2014
Return On Investment • Return On Investment calculates the amount of value (measured in currency) that would be generated for every dollar invested in restoration transitions. • E.g. if ROI = 0.20 that would mean for every dollar invested you receive $1.20 worth of ecosystem goods and services
Calculation of Return On Investments Deforested and degraded land to protective forests Deforested and degraded land to naturally regenerated forests Poorly managed woodlots to well managed with best practices Poorly managed woodlots to well managed with spacing only Traditional agriculture to agroforestry with maize (carbon included) Traditional agriculture to agroforestry with maize Traditional agriculture to agroforestry with beans (carbon included) Traditional agriculture to agroforestry with beans -1 -0.5 0 0.5 1 1.5
Interpreting a carbon abatement curve Which restoration transitions have the potential to sequester the most • carbon? Is that what you would have expected? If you were a social investor looking for a source of carbon offsets and • community impact which restoration transition would you invest in? Cost/benefit dimension Carbon volume dimension
DISCUSSION For more information: Andika Putraditama Kathleen Buckingham Indonesian Outreach Officer Research Associate Forest and Landscape Restoration World Resources Institute - Indonesia World Resources Institute aputraditama@wri.org kbuckingham@wri.org 12
Recommend
More recommend