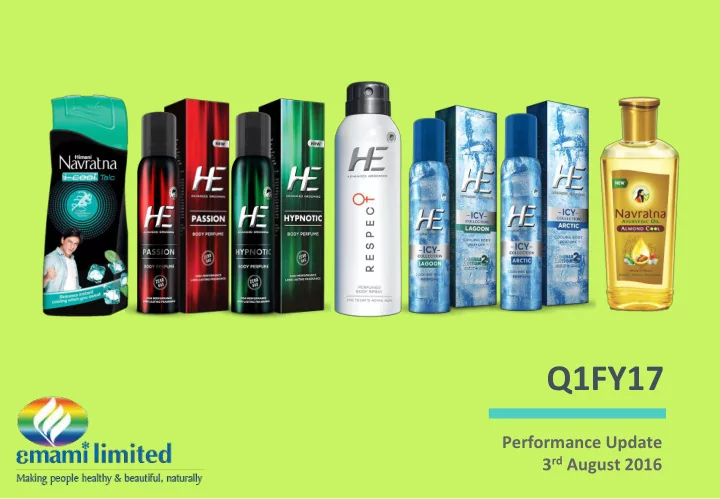

Q1FY17 Performance Update 3 rd August 2016
Q1FY17 Snapshot …Consolidated ₹ in Millions 1,282 6,444 1,472 987 1,091 5,372 Q1FY16 Q1FY17 Q1FY16 Q1FY17 Q1FY16 Q1FY17 SALES EBIDTA CASH PROFIT* However, PAT at ₹ 566.5 mn was lesser compared to Q1FY16 because of amortization of Kesh King intangibles by ₹ 598.2 mns against ₹ 125.7 mns in the corresponding period in PY. *Cash Profits = PAT+ Depreciation & Amortization. Financial results for Q1FY17 prepared in accordance with Indian Accounting Standards (Ind-AS) and the results for Q1FY16 and FY16 have been re-casted in accordance with Ind-AS to facilitate comparison 2
Sales Growth • Consolidated Sales grew by 20% CSD • Volumes grew by 17% 4% IMD • 12% Organic Sales grew by 9.5% • Organic Volumes grew by 6.4% Q1FY17 Sales Contribution DOMESTIC 21% 14% INTERNATIONAL Domestic 84% CSD 12% 3
Brand-wise Performance Q1FY17 Domestic Brand-wise Performance Update
Navratna Cool Oils • Sales grew by 8% . • Cool Oils re-launched in a new packaging with a new campaign featuring Amitabh Bachchan . • Gained Volume Market Share by 100 bps at 62.3% • Launched Navratna Almond Cool Oil , in a non-sticky format. Endorsed by Shilpa Shetty. 5
Navratna Cool Talc • Sales grew by 15% . • Introduced a new variant, Navratna i-Cool Talc • Powered by ‘ Intelligent Sweat Sense ’ technology, the i-cool talc offers cooling not only during application but also releases an instant burst of cooling for the second time during actual sweating. • Volume Market Share at 24.1% 6
Balms Range • Sales grew by 6% . • Zandu Balm re-launched with new packaging and formulation with better sensory and efficacy. • Launched 1 ml SKU of Zandu Balm Ultra Power in Andhra Pradesh & Karnataka • Maintained leadership with a Volume Market Share of 54.5% 7
Fair and Handsome Range • Fairness Cream’s Market Share (Vol.) grew by 120 bps at 64.9% • Sales grew by 1% • Re-launched with new formulation and packaging. • Face wash grew by 16% . • Introduced a convenient 7 gm tube pried at ₹ 10/- to penetrate the largely untapped rural and semi-urban markets. • Gained Volume Market Share by 70 bps at 12.6% 8
Kesh King Range • Sales grew by 23% on QoQ basis. • Gained Volume Market Share by 360 bps at 33.6%. BoroPlus • Sales grew by 38% . • Maintained leadership with a Volume Market Share of 76.2% 9
HE Range • Relaunched HE Deodorants with an easy to use premium packaging • Introduced a new fragrance “ HE Respect ” • Forayed into “No - Gas” Category • Body Perfume Collection: Passion & Hypnotic fragrances. • ICY Collection- Offering cooling effect on users along with long lasting fragrance. 10
7 Oils in One • Sales grew by 38% Health Care Range • Sales grew by 14% . • Pancharishtha & Nityam Churna / Tablets performed well. 11
International Business Q1FY17 International Business Performance Update
International Business OTHERS 4% CISEE 12% • International business grew by 14% IMD SAARC & SEA Cluster Wise 49% • Robust growth in Bangladesh and GCC. Contribution MENAP 35% • Maintained leadership across key categories 13
Earnings Analysis Q1FY17 Financial Analysis
Margin Profile Gross Margins EBIDTA Margins A&P Spends + 390 bps + 450 bps + 70 bps 23.8% 64.5% 22.9% 18.4% 60.6% 23.1% Q1FY16 Q1FY17 Q1FY16 Q1FY17 Q1FY16 Q1FY17 15
Financial Analysis Staff Costs Admin & Other Exp Cost of Goods Sold (as a % of Sales) (as a % of Sales) (as a % of Sales) - 10 bps - 120 bps - 390 bps 9.4% 39.4% 9.8% 35.5% 9.3% 8.6% Q1FY16 Q1FY17 Q1FY16 Q1FY17 Q1FY16 Q1FY17 Other Income A&P Spends Interest Paid ( ₹ in Millions ) ( ₹ in Millions) ( ₹ in Millions) 1,534 187 125 1,239 44 51 Q1FY16 Q1FY17 Q1FY16 Q1FY17 Q1FY16 Q1FY17 16
Summarized Results ₹ in Millions % of Particulars Q1FY17 Q1FY16 % of Sales Growth % FY16 % of Sales Sales Net Sales 6,443.7 100.0% 5,372.1 100.0% 19.9% 23,937.4 100% Materials Cost 2,286.9 35.5% 2,114.0 39.4% 8.2% 8,513.4 35.6% A&P 1,534.0 23.8% 1,238.7 23.1% 23.8% 4,304.7 18.0% 598.3 9.3% 506.6 9.4% 18.1% 2,067.6 Staff Cost 8.6% Admn & Other Exp 552.0 8.6% 526.0 9.8% 4.9% 2,207.7 9.2% EBIDTA 1,472.5 22.9% 986.8 18.4% 49.2% 6,844.0 28.6% Other Income 50.8 0.8% 186.7 3.5% -72.8% 449.1 1.9% Interest 125.1 1.9% 44.0 0.8% 184.3% 542.9 2.3% 609.2 9.5% 136.5 2.5% 346.2% 2,099.8 Amortisation of acquired TM’s/ brands 8.8% Depreciation/Amortisation of other assets 106.0 1.6% 88.4 1.6% 19.9% 449.5 1.9% PBT 683.0 10.6% 904.6 16.8% -24.5% 4,200.9 17.5% Tax 116.5 1.8% 38.5 0.7% 202.6% 582.3 2.4% PAT 566.5 8.8% 866.1 16.1% -34.6% 3,618.6 15.1% 1,281.7 19.9% 1,091.0 20.3% 17.5% Cash Profit (PAT + Dep. & Amortization) 6167.9 25.8% EPS - Rs. 2.5 3.8 -34.5% 15.9 Cash EPS - Rs. 5.6 4.8 17.4% 27.2 17
Awards & Accolades • Emami featured in the “ Super 50 Companies ” listing by Forbes India with knowledge support from PwC, India. Three key metrics — shareholder value, sales growth and return on equity were taken into consideration. • Navratna received the Silver Award for its Kumbh Mela Campaign at the WOW Awards Asia 2016 . 18
Thank You!
Recommend
More recommend