Protecting Patient Confidentiality Thomas Talbot and Gwen LaSelva - PowerPoint PPT Presentation
GIS Tools for Sharing Health Data and Protecting Patient Confidentiality Thomas Talbot and Gwen LaSelva Environmental Health Surveillance Section New York State Department of Health NYGeoCon November 12-13, 2013 Saratoga Springs, NY Health
GIS Tools for Sharing Health Data and Protecting Patient Confidentiality Thomas Talbot and Gwen LaSelva Environmental Health Surveillance Section New York State Department of Health NYGeoCon November 12-13, 2013 Saratoga Springs, NY
Health data maybe collected at different sub-county scales • Residential address • Census blocks • Census tracts • ZIP codes • Towns
Problems using Pre-existing Regions Unequal populations Populations are too large. Difficult to see variations in rates between local communities. or Populations are too small so data is suppressed to protect confidentiality or rates are unstable due to chance.
The Demand for Community Level Data • State health departments and federal health agencies such as the CDC often provide county level health indicators. • Stakeholders want the data at a finer geographic scale.
Environmental Facilities & Cancer Incidence Map Law, 2008 § 3-0317 • Plot cancer cases by census block, except in cases where such plotting could make it possible to identify any cancer patient. • Census blocks shall be aggregated to protect confidentiality.
Geographic Aggregation
Small numbers of children with elevated blood lead levels can cause high rates in sparsely populated areas due to chance.
Geographic Aggregated Count & Rate Maps • Protect Confidentiality so data can be shared. • Reduce random fluctuations in rates due to small numbers.
Disclosure of confidential information Census Blocks Some census blocks may contain only one house.
Small Numbers and Unstable Disease Rates • In the following example points are randomly placed on a map with an average of 10 points in each grid cell. • The observed number of points vs. the expected number of points changes as we move the grid or if we change the scale by combining grids.
Need for an Aggregation Tool • Merge small areas with neighboring areas to provide more stable rates of disease and/or protect confidentiality. – Aggregation can be done manually. – Existing automated tools were difficult to use or did not fulfill requirements.
NYSDOH Geographic Aggregation Tool Requirements • Aggregate small areas into larger ones. • User decides how much aggregation is needed. Based on cases and/or underlying population • Works with various levels of geography. • Can nest one level of geography in another Example: Cens us tracts are aggregated. Aggregated areas do not cross county borders • Uses open source free software (R). • Outputs results for use in mapping programs.
Geographic Aggregation Tool Regions Original Census Block Data Data Census Block Cases Region Census Block Cases 2004 2 A 2004 2 2005 11 A 2005 11 R Tool 3005 2 B 3005 2 3007 3 B 3007 3 3008 8 B 3008 8 3009 3 B 3009 3 3010 4 B 3010 4 2001 9 C 12001 9 2002 6 6 C 2002 Cases & Block Boundaries Aggregated Block Boundaries Cases Region 13 A 20 B 14 C
How does the GAT Determine which areas to Merge? • Example: Merge areas in a series of pairwise merges until all areas have at least 250 births. • Areas with 250 births will on average have about 15 low birth weight births.
1 st Area to Merge Select areas with less then 250 births of those areas select the area with a count closest to 250
Select Neighbors Tool can be set so neighbors need to be in same region (e.g. county)
Three methods used to select neighbors to merge • Nearest neighbor (closest centroid) • Smallest population (e.g. number of births) • Most similar characteristic.
Select Nearest Neighbor
Select Area with the Fewest Births
Select Area with Most Similar Poverty Level
In the case of islands, GAT chooses the closest area if there are no adjacent neighbors.
Water
Original ZIP Codes 3 Years Low Birth Weight Incidence Ratios
Aggregated to 250 Births per ZIP Code Group
Performance Measures • Compactness • Similar population sizes. • Number of aggregated areas. • Aggregated zones are contained within larger areas. • Tool can handle large numbers of polygons • Speed
New York State Descriptive Statistics Year 2000 populated census blocks New Regions: Level of Aggregation Original Census 6 cases 12 cases 24 cases Statistic (calculated using Blocks populated regions only) Number of regions 225,167 39,748 21,525 11,381 39 385 770 1,467 Median Population Median number of cases 1 10 20 38 1 4 7 14 Median number of blocks NYS number of cases (5 yrs) 470,000 NYS population 2000 18,976,457 Note: The range in the census block populations is 0 - 23,373 Persons
Compactness
GAT Outputs both KML & SHP Files
The Geographic Aggregation Tool helped us provide fine scale cancer data to the public.
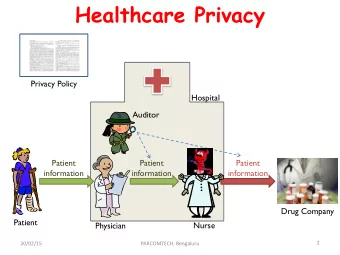
GeoMasking • Masking: Obscure specific data elements by replacing sensitive data with realistic but not real data. • Geomasking: The elements being replaced are the geographic coordinates.
Why do we need to do this? Maps can be registered to real-world coordinate systems. Hypothetical Disease cases Census boundary
Example: Registering a Map In Google Earth
`
NYSDOH GeoMasking Tool Randomly Moves Points within User Defined Area
Tool can be set to prevent new point locations from moving into a different exposure area. 1000 Possible point locations 1000 possible point locations within 500 meters. Restricted to a within 500 meters study area or exposure zone.
Points are moved at least 100 meters but less then 500 meters
Options for Determining Move Distances 1. Min. & max distances points moved are fixed for all points. or 2. User set distances as a function of population density. – For example in densely populated areas points are moved less then in sparsely populated areas.
Our Tools are easy to use, have GUI Interfaces and User Guides for more info: Tom Talbot tot01@health.state.ny.us Gwen LaSelva gdb02@health.state.ny.us
Recommend
![REFUGE CONTAINER FIRE PREVENTION PREVENTING PROTECTING RESPONDING [etc] PREVENTING PROTECTING](https://c.sambuz.com/436759/refuge-container-fire-prevention-s.webp)


More recommend
Explore More Topics
Stay informed with curated content and fresh updates.