
SLIDE 1
1
The Device Physics of Cellular Logic Gates
Ron Weiss
Department of Electrical Engineering Princeton University
NSC-1
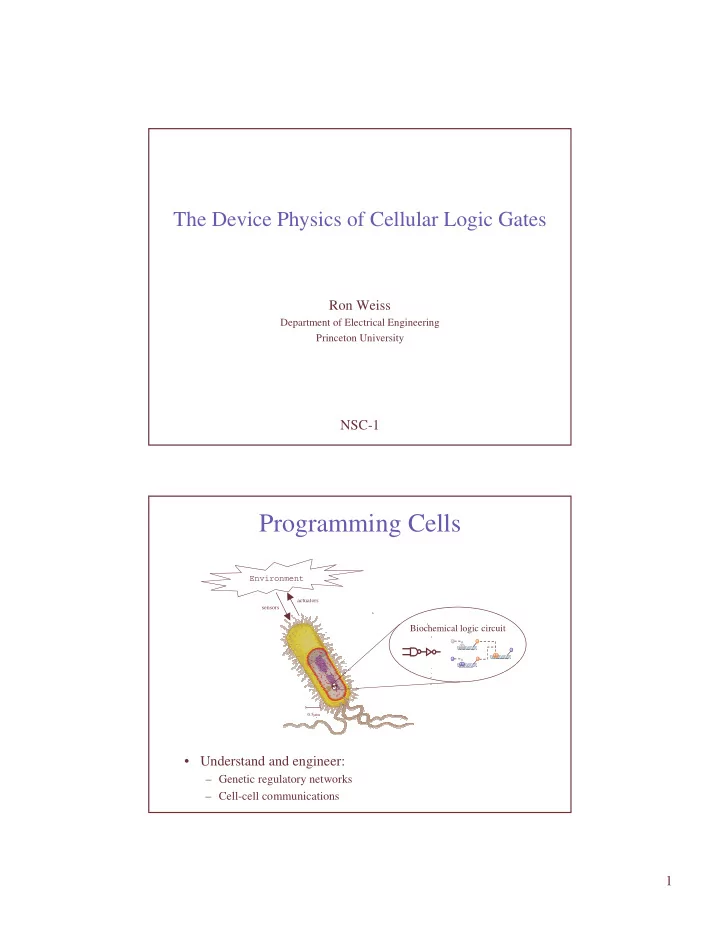
Programming Cells
0.5µm
Biochemical logic circuit
Environment
sensors actuators
- Understand and engineer:
– Genetic regulatory networks – Cell-cell communications