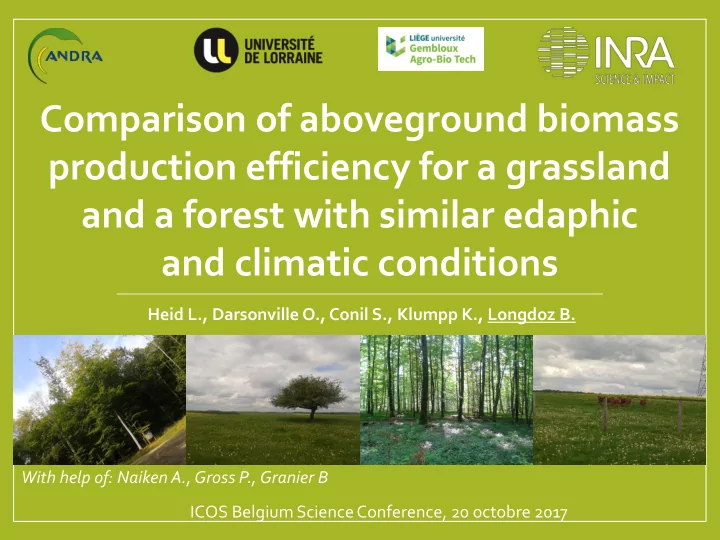

Comparison of aboveground biomass production efficiency for a grassland and a forest with similar edaphic and climatic conditions Heid L., Darsonville O., Conil S., Klumpp K., Longdoz B. With help of: Naiken A., Gross P., Granier B ICOS Belgium Science Conference, 20 octobre 2017
CONTEXT & OBJECTIVES 2
• Evolution in ecosystem management - Intensification, soil changes (structure, fertility, … ) • Climate change (Temperature, Pluviometry) - Drift & extreme events (drought, heat wave, flood, … ) • Need of better understanding of ecosystem C balance - Strategies in C allocation, sequestration & emission (Trumbore, 2006) - Uncertainties around the spatio-temporal variability of milieux semi- theses strategies (Campioli et al., 2013) Humid Building naturels, zones zones 5% bâti humides et 5% Crops aquatiques 10% 10% 30% +0.5% cultures /an 30% +0.1%/an Forests +0.5%/an forêt 26% 26% -0.7%/an -0.7%/an espaces Mixed hétérogènes 13% 13% prairies Grasslands 16% 16% 3
NEE= GPP + Reco Rauto aerial GPP Compounds of Interest Forest : aerial Structural C Grassland: Digestible C GPP = Rauto + BP + exudates + COV Compound of Interest Biomass Production Production Efficiency Efficiency CIP + ( réserves, SS ,…) CIPE= CIBP/GPP BPE = BP/GPP Vicca et al. , 2012 Rhet soil Rauto soil aBPE (leaves, wood) bBPE (roots) 4
• Only annual BPE/aBPE • Large variability in annual BPE/aBPE - Ecosystem type, Nutriments availability, Mean annual temperature, Specie, Age, Management, [CO 2 ] ⇛ Seasonal variability of aBPE ? Which drivers ? ⇛ Comparing aBPE evolutions of Forest vs Grassland Same meteo and soil 5
MATERIAL ET METHOD 29/06/2016 6
Sites Forest Grassland • Type of soil: calcisol (7.1 <pH<8) • Beech (88%) stand ~55 ans • Vegetation: Bromus hordaceus (53.8%), Bellis perennis (16.8%) • Soil type: calcisol (7.1 <pH<8) Dates Event • Stem density: 800 stems/ha 30/03/2014 Fertilization (NPK) • Height: 20-25m 13/04/2014 Grazing (Part 1) • LAI = 8 05/06/2014 Mowing (Part 2) 12/07/2014 Grazing (Part 1 +2) 29/06/2016 7
CO 2 Flux and weather measurements • « Traditional » equipment with LI-7200 enclosed • Data processing : Frequency correction (Fratini); Flux quality selection (Mauder, u*threshold), Gapfilling & Partitioning (Reinschtein) 29/06/2016 8
Biomass measurements Litter traps Dendrometers Cages excluding grazing x 10 = 0.64 m² dispatched randomly on the 5.1ha 80 cm 80 cm Allometric equations fitted on Lab analyses Dates Sampling the site (diameter, age, height) of collected 23/02/2014 Cleaning 1 litter for C Lab analyses of wood micro-cores 16/04/2014 Growth 1 (Cleaning 2) content for wood density and C content 23/05/2014 Growth 2 (Cleaning 3) 05/06/2014 Cleaning 4 24/07/2014 Growth 3 (Cleaning 5) 11/09/2014 Growth 4 (Cleaning 6) 06/11/2014 Growth 5 Lab analyses of cleaning Lab Biochemical analyses for biomass for C content (non-) structural C 9
RESULTS 10
-549gC m -2 NEE= 1089 gC m -2 GPP + Reco -1639 gC m -2 GPP Rauto aerial GPP = Rauto + BP + exudates aBPE aBP + COV 652 gC m -2 0.39 CIP + ( réserves, SS ,…) Rhet soil Rauto soil 11
-484 gC m -2 -549gC m -2 NEE= GPP + Reco -1538 gC m -2 1054 gC m -2 1089 gC m -2 -1639 gC m -2 aBPE aBP 400 gC m -2 GPP 0.25 Reco 652 gC m -2 0.39 1. Forest : more assimilated C dedicated to GPP = Rauto + BP + exudates aboveground biomass + COV 2. Grassland : Belowground or Rauto ? (soil 12 ingrowth cores)
Intra-annual variability (Forest) 7.0 Aboveground wBP (gC.m -2 .d -1 ) aBP 6.0 5.0 aBP - d fixed 4.0 3.0 2.0 1.0 0.0 10.04-05.05 06.05-02.06 03.06-30.06 01.07-28.07 29.07-25.08 26.08-22.09 22.09-23.11 1. Density correction up to 22% 2. Can’t be neglected for studies on C allocation seasonal variability 13
Intra-annual variability (Forest) GPP 1. Large intra-annual variability 400 aBP bois 350 aBP feuille C content (gC/m²) 2. No apparent influence of meteo or soil 300 250 conditions 200 150 3. Seasonal bell-shaped phenology similar to the 100 photoperiod 50 0 Septembre Août Octobre Avril- Mai Juillet Juin 1.20 1 aBPE 1.00 0.80 0.55 0.60 0.46 0.32 0.31 0.40 0.20 0.07 0.00 1 2 3 4 5 6
Intra-annual variability (Grassland) 0.60 0.50 0.40 aBPE 0.30 0.20 0.10 0.00 22/02-16/04 17/04-23/05 05/06-24/07 25/07-11/09 12/09-06/11 Fertilization Grazing Mowing Management: 1. Larger variability ⇔ forest 2. Impact of mowing ? 15
0.7 NSC 0.6 C_Cel+L 0.5 Production efficiency C_Hem 0.4 0.3 0.2 0.1 0.0 October- April Mai June July August Sept November 16
TAKE HOME MESSAGE 17
• Forest allocated larger % of GPP to aboveground • Large aBPE seasonal variability (larger on grassland) • Forest : continuous curve ⇔ Grassland : impact of mowing • Temporal evolution of the reserve/wood formation strategy Thank 18
Recommend
More recommend