Presentation April 2018 Forward-Looking Statements This - PowerPoint PPT Presentation
RBC Capital Markets Investor Presentation April 2018 Forward-Looking Statements This presentation and comments associated with it contain forward-looking statements including statements relating to U.S. housing recovery, the potential for
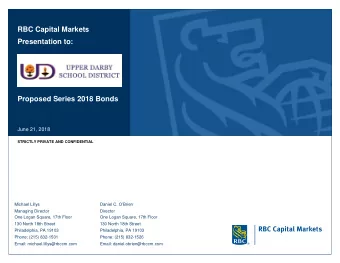
RBC Capital Markets Investor Presentation April 2018
Forward-Looking Statements This presentation and comments associated with it contain forward-looking statements including statements relating to U.S. housing recovery, the potential for constrained lumber supply, earnings sensitivity and estimated annual capital expenditures. These statements are subject to the cautionary statement which introduces West Fraser’s 2017 Annual Management’s Discussion & Analysis which can be accessed on the Company website www.westfraser.com. 2
West Fraser Then and Now THEN THEN From humble beginnings to North America’s largest lumber producer NO NOW 3
Wood is Good Wood is an ideal building ma ood is an ideal building mater terial ial 4 Source: reTHINK Wood
Integration - We Attain Value from 100% of Our Resources Sustainably managed forest lands Reforestation Lumbe ber Ply lywood od Reman anuf ufact actur urer ers Sawdust ust and shaving vings Chip ips Bark k (Fuel el) Supply y agreem emen ents s BCTMP Pulp lp NBSK Pulp lp MDF Bio ioprod oduct ucts Heat and Ele lect ctrici icity (e.g. e.g. pelle llet pla lants) nts) Integrated fiber strategy to maximize the value of the log 5
Sustainable Forest Management • In the last 3 years we’ve planted more than 182 million trees • West Fraser manages 7 million hectares of certified sustainably managed forests • We’ve planted more than 1.7 billion trees since 1955 • We plant approximately two trees for every tree we harvest, 60+ million/year • Planted in a line, 1.7 billion trees would circle the earth 89 times Continuously renewing the resource 6
Market Overview
Lumber V Appeals and Timeline 2017 2018 2019 2020 Post cash deposits DOC CVD and AD at final FDs & Orders AD & (Dec, 2017) CVD rates NAFTA Appeals (Dec, 2017) WTO Appeals (Dec, 2017) CVD Period of Review 1 CVD Administrative Review 1 Post cash 1/1/17-12/31/17 1/19-6/20 deposits at final AR1 rates AD Period of Review 1 AD Administrative Review 1 6/30/17-11/30/18 1/19-6/20 Preliminary Deposit Rate Final Deposit Rate Current Expense Rate CVD 24.12% 17.99% 17.99% AD 6.76% 5.57% 0.88% Total 30.88% 23.56% 18.87% 8
U.S. Lumber End Use U.S. Lumber End Use 2017 Nonresidential/ Mobile, 6% Single Family Construction, 26% Industrial Production, 24% Multifamily Construction, 3% Residential Improvements, 41% Residential construction and renovation the key driver of lumber demand 9 Source: FEA and WF
U.S. Existing Home Sales Continue to Improve Existing House Sales Annualized (000) 8,200 7,200 6,200 5,200 4,200 3,200 2,200 97 98 99 00 01 02 03 04 05 06 07 08 09 10 11 12 13 14 15 16 17 18 U.S. Existing Housing Inventory 000's units Months Supply Seasonally Adjusted 4,400 14.0 3,900 12.0 3,400 10.0 2,900 8.0 2,400 6.0 1,900 4.0 1,400 2.0 97 98 99 00 01 02 03 04 05 06 07 08 09 10 11 12 13 14 15 16 17 18 Existing House Inventory Months supply Existing home sales continue to improve albeit with low inventories 10 Source: National Association of Realtors
U.S. Housing Starts Thousands 2,200 2,000 1,800 1,600 1,400 1,200 1,000 800 600 400 200 0 2005 2006 2007 2008 2009 2010 2011 2012 2013 2014 2015 2016 2017 2018F 2019F 2020F Total Single Multi Underlying Demand Expect that the recovery has room to continue 11 Source: U.S. Census Bureau, FEA Forecast 01-18
North American Lumber Consumption 80 75 72 70 64 64 62 60 58 60 56 53 51 50 48 50 45 43 39 43 40 30 20 10 0 2005 2006 2007 2008 2009 2010 2011 2012 2013 2014 2015 2016 2017 2018F 2019F 2020F US Consumption Canadian Consumption Demand for lumber expected to grow by 2 billion board feet per year 12 Source: US Census Bureau, Statistics Canada, West Fraser Forecast
North American Lumber Production 80 25 70 20 60 50 15 40 Billion Bf 10 30 20 5 10 0 0 2005 2006 2007 2008 2009 2010 2011 2012 2013 2014 2015 2016 2017 2018F 2019F 2020F U.S. Canada Canada West (R Axis) Canada East (R Axis) US West (R Axis) US South (R Axis) US South expected to contribute most of growth in supply 13 Source: US Census Bureau & Statistics Canada, West Fraser Forecast
North American Lumber Supply & Demand 72 Imports 2005: 3.0 billion board feet 70 Imports 2010: 0.5 billion board feet Imports 2017: 1.4 billion board feet 68 2020: 66 4.2 billion bf 64 Billion bf 62 60 58 56 54 52 2015 2016 2017 2018F 2019F 2020F Production Demand On North American Mills Potentially growing gap in lumber supply 14 Source: US Census Bureau & Statistics Canada, West Fraser Forecast
North American Lumber Capacity Estimated Lumber Capacity (Mmfbm ) 8,000 7,000 6,000 5,000 SPF SYP Other 4,000 3,000 2,000 1,000 0 Source: Public filings, Forest Economic Advisors and West Fraser estimates Changing landscape of US South Sawmilling Top 5 Operators West Fraser Capacity # of Mills # of Mills Capacity % of Capacity # Mills % of Capacity Capacity 1997 17.4 430 64 5.6 33% - - - 2017 18.5 230 66 9.0 47% 3.0 21 16.7% Source: Company reports, FEA, Timbermart South West Fraser has largest share of a growing market 15
China Imports of Logs and Lumber (M M3) 100,000 90,000 80,000 70,000 60,000 50,000 40,000 30,000 20,000 10,000 0 2005 2006 2007 2008 2009 2010 2011 2012 2013 2014 2015 2016 2017 Lumber Logs Demand from China continues to grow 16 Source: General Administration of Customs of The People’s Republic of China
North American Offshore Lumber Exports 8 6.9 7 6.5 6.5 6.3 5.9 6 5.5 5.5 4.8 5 4 3.5 Billion Bf 3.2 3.2 3.0 2.7 3 2 1 0 2005 2006 2007 2008 2009 2010 2011 2012 2013 2014 2015 2016 2017 Offshore Exports US Offshore Exports Canada Total Export volume leveling off 17 Source: US Census Bureau & Statistics Canada
West Fraser Overview
Our Strategy Operational Geographic Excellence Diversification Product Integration Diversification Straightforward strategy for success in all market conditions 19
Operational Excellence Straightforward, consistent business model Internal and external Managing to ensure a committed workforce benchmarking Cost control and Continuous efficiency reinvestment Focused on continuous improvement in all aspects of the business 20
Operations diversified by geography Lumber Capacity B.C. 34% U.S. 43% Alberta 23% Strong presence in key lumber producing regions 21
Product Diversification LUMBER PANELS PULP & PAPER 34 mills 7 mills 5 mills SPF 4.1 Bfbm Plywood: 850 MMsf3/8” NBSK: 570 Mtonnes SYP 3.1 Bfbm MDF: 250 MMsf3/4” BCTMP: 680 Mtonnes Total 7.2 Bfbm LVL: 3.2 MMcf Newsprint: 135 Mtonnes 2017 Revenue Mix: Lumber Pulp Panels 0% 10% 20% 30% 40% 50% 60% 70% 80% 90% 100% Diversified across multiple end uses 22
Pulp End-Use Products Chemical Pulp Mechanical Pulp Box Board, 6% Specialty, Printing 8% Fluff, 10% and Tissue, Writing, 34% Tissue, 5% 38% Other, 3% Specialty, 22% Printing Box and Board, Writing, 46% 28% Multiple end uses and markets 23 Source: PPPC 2016
Market Pulp Supply and Demand Chemical Pulp BCTMP • No new major capacity additions 2018 to 2020 • Pulp demand projected to grow 2.2% over next 5 years • Demand growth driven by tissue and packaging demand • Growth will be primarily in Asia • Conversions of chemical hardwood to dissolving pulp will constrain hardwood pulp supply 24
Capital Strategy • Reinvest profits to lower costs, improve efficiency through technology and improved processes • Capital spending in 2017 of $336 million New merchandiser and debarker in High Prairie, Alberta • Estimated 2018 spending of $300-$350 million • Growth through opportunistic acquisitions focused on solid wood New mill being constructed in Opelika, Alabama Prudent capital deployment 25
$1.6B in capital projects Major rebuilds of 10 sawmills Upgraded 8 planers Built 6 energy and bioproducts Added 30 continuous kilns projects 26 Years: 2013-2017
3 year cumulative capital allocation $2,000 $1,800 $1,600 $829 $1,400 $1,200 $1,000 $1,892 $340M retuned to shareholders $800 $602 $69 $600 $73 $400 $267 $26 $200 $216 $1.4B Reinvested in the business $0 Cash from Capex Acquisitions Debt service Dividends Buybacks Other Retained operations and cash flow leverage Consist Cons istently ently deploying capit deploying capital al to cr to create eate value value 27
West Fraser Total Shareholder Return Share Value Traded TSR June 2006 to Dec 2017 Cdn$ Million 16% 14.2% Source: TD 4,500 14% 4,000 11.1% 12% 3,500 9.6% 10% 3,000 8.1% 7.9% 7.8% 8% 2,500 5.8% 2,000 6% 4.7% 1,500 4% 1,000 2% 500 0% 0 2017 2016 2015 WFT CFP IFP ✓ Proven ability to generate strong cash flow, even in worst markets ✓ Consistent, straightforward business plan ✓ Loyal, long-term employee and management base ✓ Conservative financial management coupled with proven ability to grow strategically ✓ Strong historical shareholder returns 28
Recommend


More recommend
Explore More Topics
Stay informed with curated content and fresh updates.